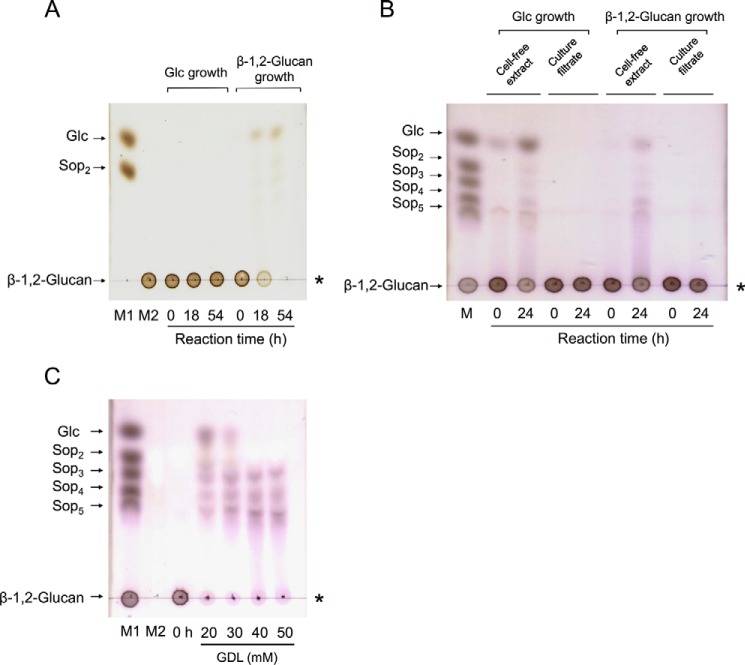
Figure 1.
TLC analysis of β-1,2-glucan-hydrolyzing activity of C. arvensicola and C. pinensis. A, C. pinensis (culture filtrates). B, C. arvensicola (culture filtrates and cell extracts). Culture filtrates and cell extracts (30 μl) were mixed with the same volume of 1% (w/v) β-1,2-glucan (average DP 64) and then incubated at 25 °C. An aliquot of each mixture was spotted onto a TLC plate. Lane M contains markers (1 μl of 0.2% each sugar). C, TLC analysis of β-glucosidase inhibition by GDL. A reaction mixture (20 μl) containing 12.5% (v/v) cell extract of C. arvensicola, 0.5% (w/v) β-1,2-glucan, 100 mm MOPS-NaOH buffer (pH 6.5), and 20–50 mm GDL was incubated at 30 °C for 2 days, and then each reaction mixture was spotted onto a TLC plate. Lanes M1 and M2 contain markers (M1, 1 μl of 0.2% each sugar; M2, 1 μl of 20 mm GDL). The asterisk indicates the origin on the TLC plate.

