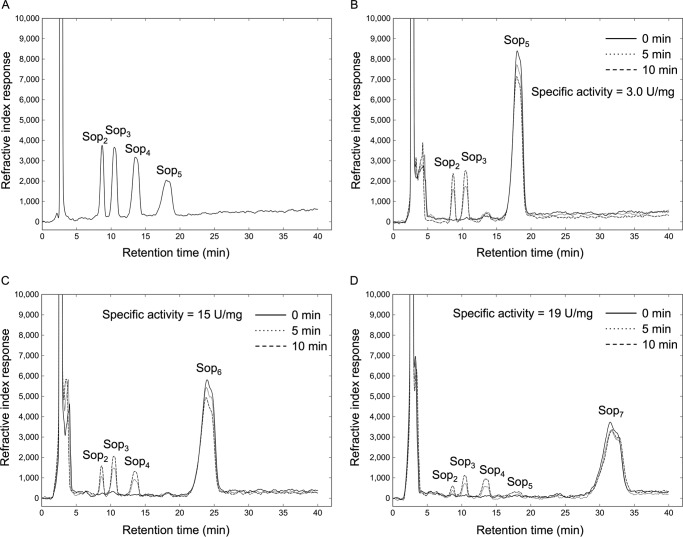
Figure 6.
HPLC analysis of the action patterns of Cpin_6279rC on Sopns. A, reference chromatogram of 2 mm Sop2–5. B–D, monitoring of the reaction products derived from Sop5 (B), Sop6 (C), and Sop7 (D). The solid line represents the sample before incubation with Cpin_6279rC. The dotted and dashed lines represent the samples after incubation with Cpin_6279rC for 5 and 10 min, respectively.

