Figure 2.
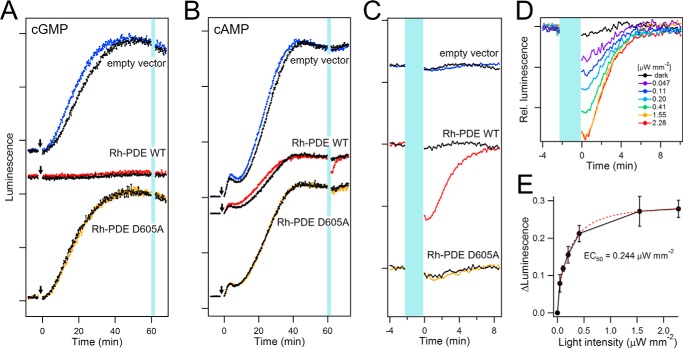
Enzymatic activity of Rh-PDE in HEK293 cells. A, luminescence signals representing cGMP levels, as observed in HEK293 cells with the empty vector (top), Rh-PDE (middle), and the PDE-inactive D605A mutant (bottom). HEK293 cells were preincubated in the culture medium with all-trans-retinal in the dark. The arrows and vertical light-blue line indicate sodium nitroprusside treatments and irradiation at 510 nm with 2.28 μW mm−2 intensity, respectively, and the luminescence signals of non-irradiated cells are shown as a control (black lines). B, luminescence signals representing cAMP level, as observed in HEK293 cells with the empty vector (top), Rh-PDE (middle), and the PDE-inactive D605A mutant (bottom). HEK293 cells were preincubated in the culture medium with all-trans-retinal in the dark. The arrows and vertical light-blue line indicate forskolin treatments and irradiation at 510 nm with 2.28 μW mm−2 intensity, respectively, and the luminescence signals of non-irradiated cells are shown as a control (black lines). Only HEK293 cells expressing Rh-PDE (red line in the middle panel) exhibited a decrease of the luminescence signal, indicating that cAMP concentration is lowered by light. C, changes of luminescence signals upon 2-min 510-nm irradiation (light-blue line) of HEK293 cells with the empty vector (top), Rh-PDE (middle), the PDE-inactive D605A mutant (bottom), expanded from B. Colored and black lines represent the data with and without irradiation, respectively. D, intensity dependence of the light-induced cAMP concentration decrease by Rh-PDE (cells were irradiated for 2 min with 510-nm light with 0–2.28 μW mm−2 intensities). E, peak amplitudes of luminescence decrease plotted against the light intensity (n ≧ 5 cells). Error bars, S.D. The half-maximal light intensity (EC50) was determined to be 0.244 μW mm−2 by a single exponential decay fit (red dashed line).

