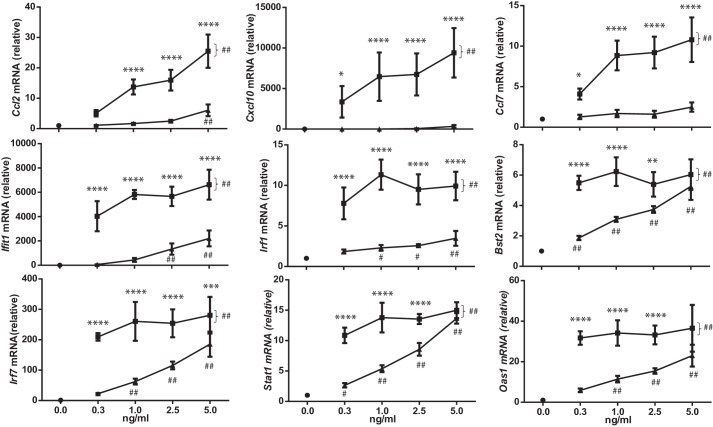
Figure 6.
Quantitative RT-PCR analysis of the response of L929 cells to treatment with IFN-β (■) or IFN-β FLETVR (▴) for 3 h. The amplified target from each sample is relative to the levels of 18S in the same sample. All data is normalized to mRNA levels detected in untreated cells (●) and expressed as the mean ± S.D. of at least three independent experiments performed in technical triplicate. Significance indicated above the data points compares treatment between IFN-β and IFN-β FLETVR at the same protein concentration (*, p < 0.05; **, p < 0.01; ***, p < 0.001; ****, p < 0.0001 (two-way ANOVA with Sidak's multiple comparisons testing)). All IFN-β-treated samples (as demonstrated by the bracket at the right-hand side of each graph) show -fold induction significantly greater than the untreated samples (##, p < 0.01 or less; two-way ANOVA with Dunnett's multiple comparisons testing). Significant difference in -fold induction between IFN-β FLETVR-treated and untreated samples is indicated (##, p < 0.01; #, p < 0.05; two-way ANOVA with Dunnett's multiple comparisons testing).

