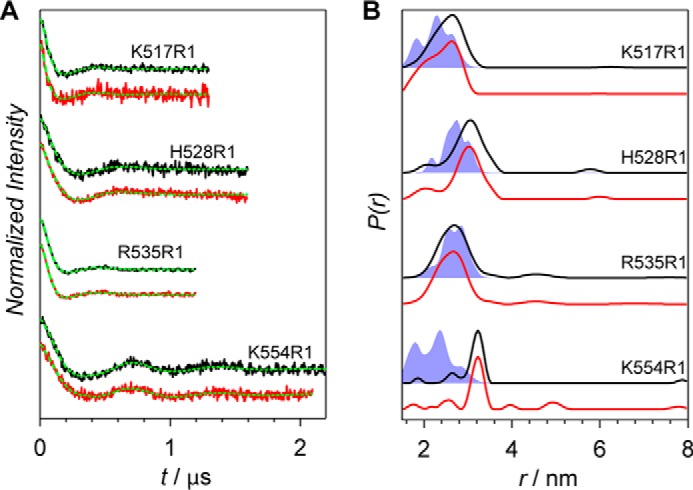
Figure 4.

X-band PELDOR data of the Agp1 homodimer spin-labeled at positions 517, 528, 535, and 554. A, PELDOR time-domain data of the K554R1, R535R1, H528R1, and K517R1 mutants of the Agp1 phytochrome homodimer at 60 K. Experimental data after background correction of the Pr and Pfr forms are shown in black and red, respectively. Fits obtained by Tikhonov regularization are shown in green. B, experimental distance distributions of the Pr form (black lines) and the Pfr form (red lines) are compared with MMM predictions (shaded blue areas).
