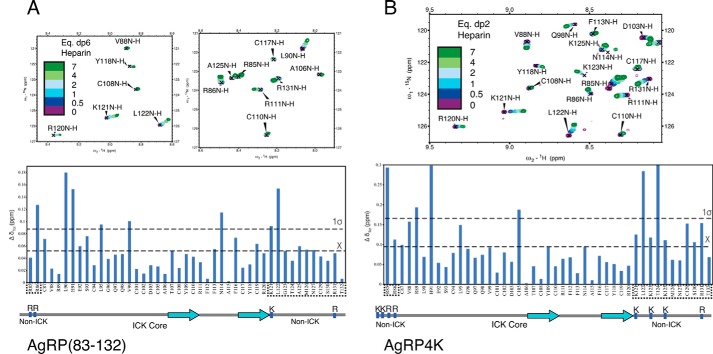
Figure 6.
HSQC chemical shift perturbation data from titration of heparin into AgRP peptides. A, top panels, HSQC data of AgRP(83–132) titrated with heparin dp6 showing residues from both C-terminal loop (Lys-121, Leu-122, and Ala-125) and N-terminal segment (Arg-86) shifting. A and B, bottom panels, data plotted as Δ chemical shift. A Δδ value is considered significant when it exceeds 1 S.D. over the mean chemical shift. Non-ICK regions, which are important for GAG binding by ITC, are boxed. B, top panel, HSQC data of AgRP4K titrated with heparin dp2. Residues from both the C-terminal loop (Lys-121, Leu-122, Lys-123, and Lys-125) and N-terminal segment (Arg-85 and Arg-86) shift systematically with added dp2. Non-ICK regions are boxed. We were unable to observe Lys-83 and Lys-84 because of solvent exchange.

