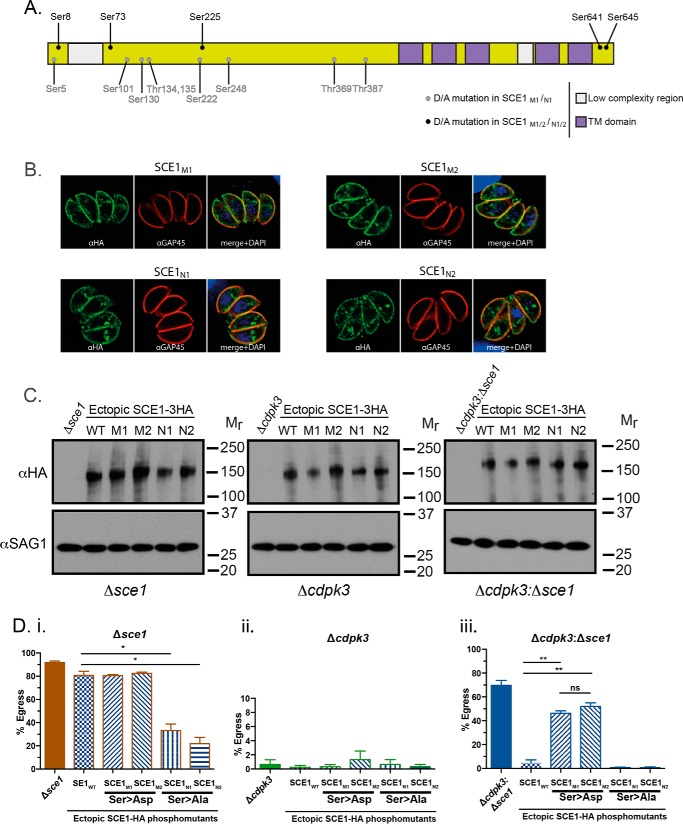
Figure 6.
Phosphorylation controls the activity of SCE1. A, schematic of SCE1 and position of identified phosphorylation sites. TM, transmembrane. B, localization of SCE1M1, SCE1M2, SCE1N1, and SCE1N2 and staining with α-HA and α-GAP45. C, Western blot of complemented lines and staining with α-HA and α-GAP45 as a loading control. D, SCE1-phosphomutant complementation egress assay, stimulated with A23187 for 3 min. Δsce1 (i), Δcdpk3 (ii), and Δcdpk3Δsce1 (iii) backgrounds were complemented with SCE1wt and two sets of phosphomimetic (SCE1M1, SCE1M2) or phospho-null (SCE1N1, SCE1N2) mutants. Error bars show mean ± S.D. *, p < 0.05; **, p < 0.001. All statistical tests were performed using two-way ANOVA and Tukey correction for multiple comparisons. The data were derived from three independent biological replicates.

