Figure 5.
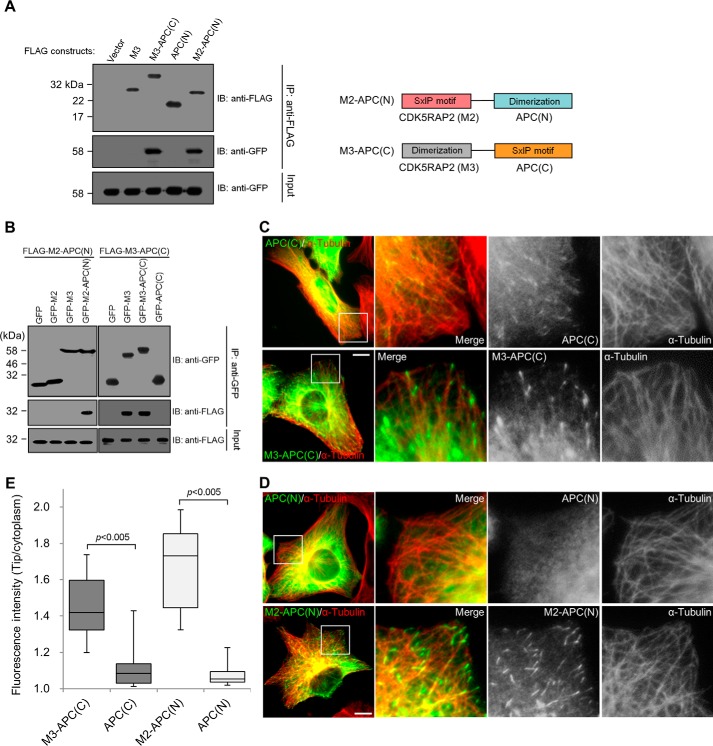
Construction of plus-end-tracking chimeras. A, the chimeras and the single domains of CDK5RAP2 and APC were transiently expressed as FLAG-tagged proteins, and EB1-GFP was co-expressed in HEK293T cells. After anti-FLAG immunoprecipitation (IP), the immunoprecipitates and the lysate inputs were analyzed by means of immunoblotting (IB). EB1-GFP was co-immunoprecipitated with the chimeras M3-APC(C) and M2-APC(N) but not with the dimerization domains APC(N) and M3 only. Right, a schematic representation of the chimeras. B, the extracts of HEK293T cells co-expressing the GFP-tagged and the FLAG-tagged proteins as indicated were subjected to anti-GFP immunoprecipitation (IP). The immunoprecipitates and the lysate inputs were analyzed by means of anti-GFP and anti-FLAG immunoblotting (IB). M2-APC(N) was coprecipitated only with the APC(N)-containing construct, whereas M3-APC(C) was coprecipitated only with the M3-containing constructs. C and D, U2OS cells were transiently transfected with FLAG-tagged APC(C), M3-APC(C), APC(N), or M2-APC(N). The cells were stained for the ectopically expressed proteins (anti-FLAG) and microtubules (anti-α-tubulin). Boxed areas are enlarged. Bars, 10 μm. E, the immunofluorescence signals of the proteins expressed at similar levels in C and D were quantified from 50 microtubule tips in 5 transfected cells to derive the microtubule tip/cytoplasm ratios. Data are presented in the same box-and-whisker format as in Fig. 1: boxes represent the 25th and 75th percentiles, a line within the boxes depicts the median, and whiskers represent the 10th and 90th percentiles. p values were calculated by the Student's unpaired two tails t test.

