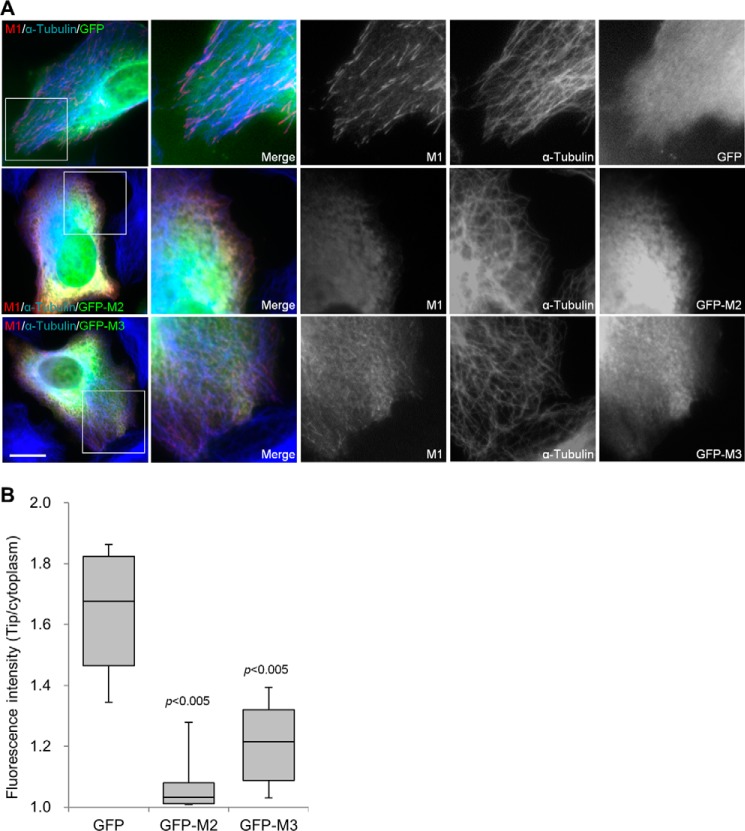
Figure 7.
M2 and M3 interfere with the plus-end tracking of M1. A, FLAG-M1 was transiently co-expressed in U2OS cells with GFP, GFP-M2, or GFP-M3. The cells were stained with anti-FLAG and anti-α-tubulin antibodies. Boxed areas are enlarged. Bar, 10 μm. B, the fluorescence intensities of M1 were acquired at the microtubule distal tips and in the cytoplasm in five transfected cells that expressed FLAG-M1 and the GFP proteins at low and moderate levels, respectively. The intensity ratios (tip/cytoplasm) are presented as box-and-whisker plots in which boxes represent the 25th and 75th percentiles, a line within the boxes depicts the median, and whiskers represent the 10th and 90th percentiles. p values (Student's unpaired two-tailed t test) indicate the significance of differences between GFP and GFP-M2 or GFP-M3.

