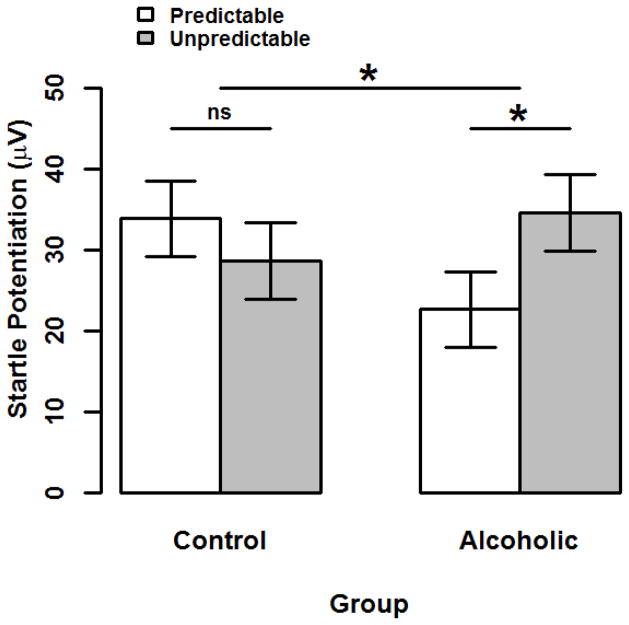
Figure 1. Startle Potentiation by Group and Stressor Type.
Bars display startle potentiation to predictable (white) and unpredictable (gray) shock within each Group (alcoholic vs. control). Confidence bars represent ± one standard error for point estimates of startle potentiation from the General Linear Model (GLM). This GLM adjusted for all covariates including Task Block Order, Startle Reactivity, Beck Anxiety Inventory, and Beck Depression Inventory (quantitative variables mean-centered). The unpredictable vs. predictable startle potentiation contrast was greater among alcoholics than controls (p=.022). Moreover, this simple effect contrast was significant among alcoholics (p=.021) but not controls (p=.291).
* - p < .05. ns - Non-significant.
Figure © 2016 John Curtin, Daniel Bradford, Jesse Kaye, and Christine Moberg under Creative Commons Attribution 4.0 International Public License CC-By

