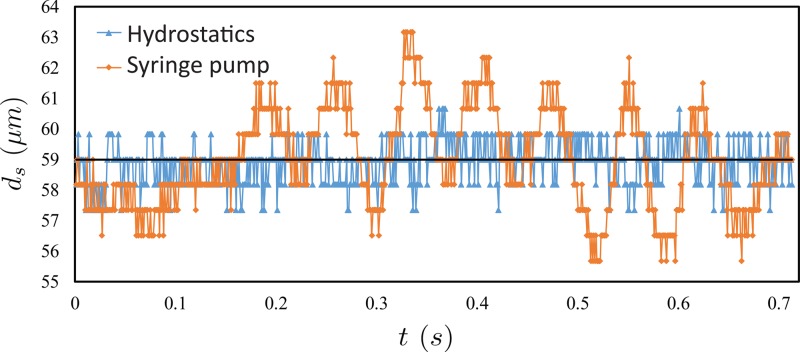
FIG. 3.
A plot of the focused flow diameter, ds, versus time, t, for experiments using hydrostatic pressure (blue triangle) and syringe pumps (red diamond) over a period = 0.7 s. The average diameter, ds, of the focused flow in both hydrostatic and syringe-pump experiments is ds = 59 μm (indicated by the black line). t = 0 s represents the first frame of the high speed video. The data show significantly larger fluctuations in the syringe pump experiments.

