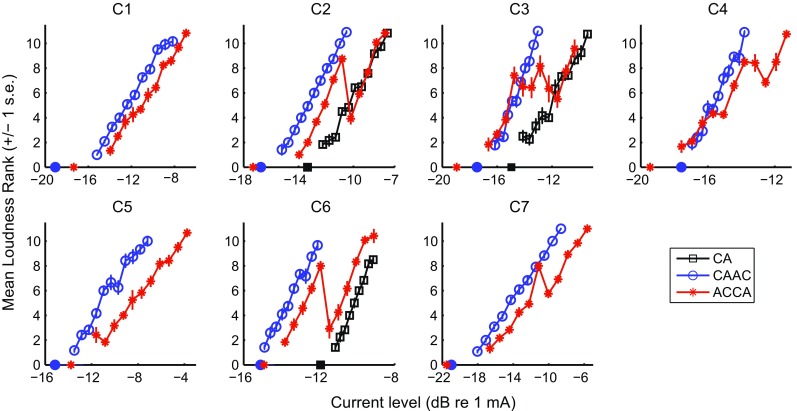
FIG. 7.

Results of experiment 2. Same as Figure 6 except that the ranks are illustrated as a function of absolute current level. For C2, C3, and C6, the additional ranking data obtained with the CA stimulus are also shown. The isolated symbols displayed on the x-axis represent the threshold values for the different pulse shapes
