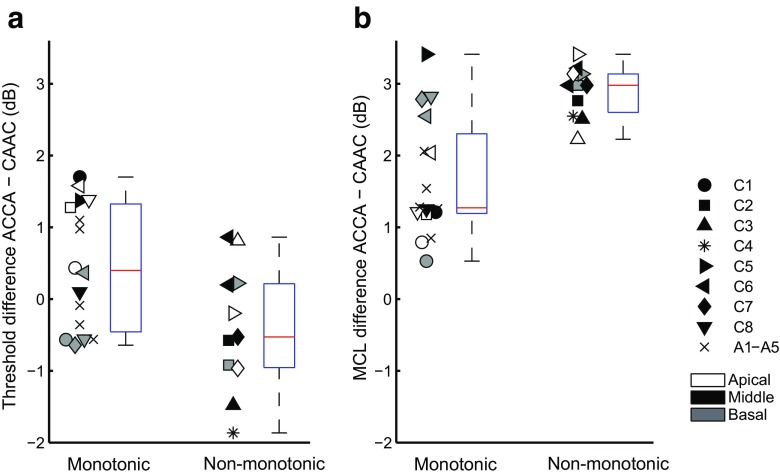
FIG. 8.
A, Difference in threshold between ACCA and CAAC for the monotonic electrodes (left) and the non-monotonic electrodes (right). The two boxplots next to the data points represent the distribution of this threshold difference showing median, 25th and 75th percentiles and most extreme data points. B, Same as A for the difference in MCL between ACCA and CAAC

