
Figure 1.
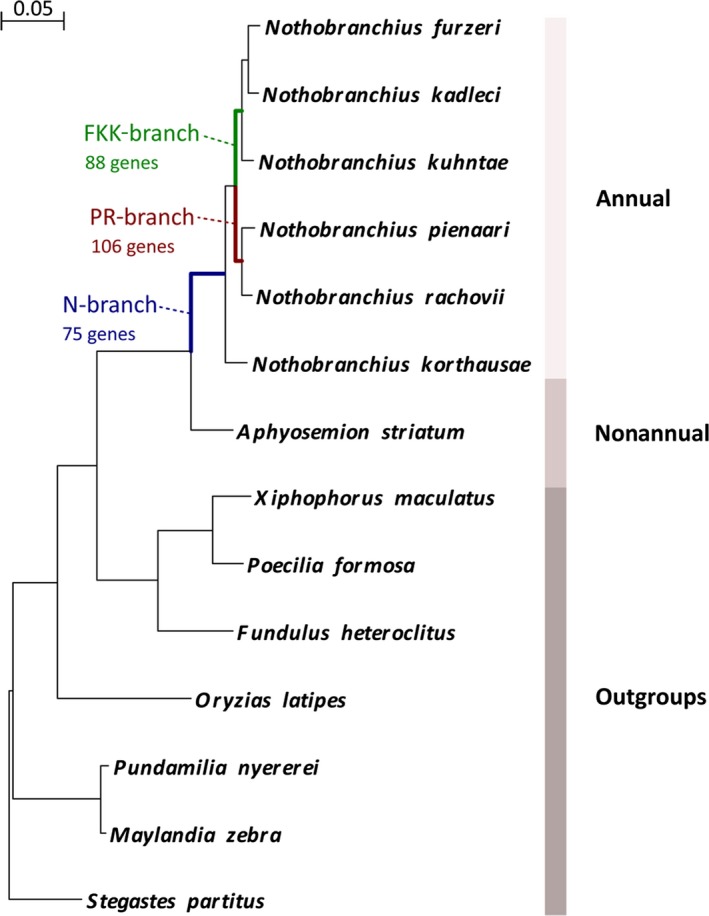
Phylogeny of the analyzed species. Maximum‐likelihood tree figure. Phylogeny of the analyzed species and their life history. Maximum‐likelihood nucleotide‐based phylogenetic tree of species that were used for genome‐scale scans for positively selected genes. Outgroups from Ovalentaria are indicated as well as the three branches (N‐, PR‐, and FKK‐branch) that are reported in the text. The alignment is based on concatenation of 4865 genes. The represented tree is the consensus of 1046 different trees created by splitting the alignment in fragments of 15 knt and calculating a tree for each fragment. The calibration bar refers to substitutions per nucleotidic site.