
Figure 6.
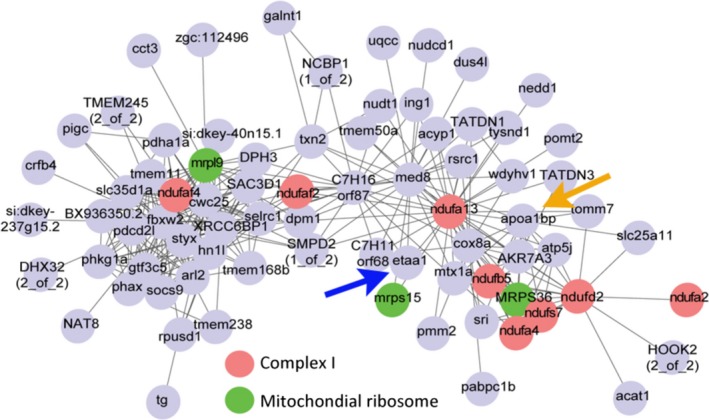
Position of ETAA1 and APOA1BP in the network of longevity‐associated genes described by Baumgart et al. (2016). Picture reproduced with permission from Baumgart et al. (2016) and the gene annotation conforms to the annotation of transcripts described in Reichwald et al. (2015). Red genes code for complex I components and green genes for mitochondrial ribosome components.