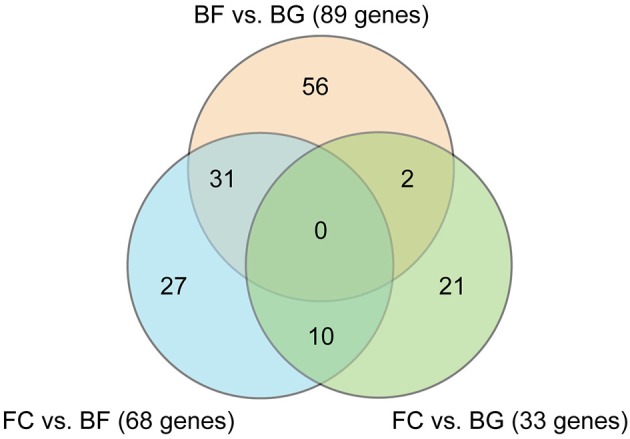
Figure 2.

Venn diagram showing the number of genes differentially regulated in longissimus dorsi comparing all the different experimental groups. Venn diagram showing the number of genes differentially regulated comparing space flown (BF) with ground controls (BG and FC) in longissimus dorsi (each group n = 5). Comparisons between the three different experimental groups are shown (BF vs. BG, FC vs. BG, and BF vs. FC).
