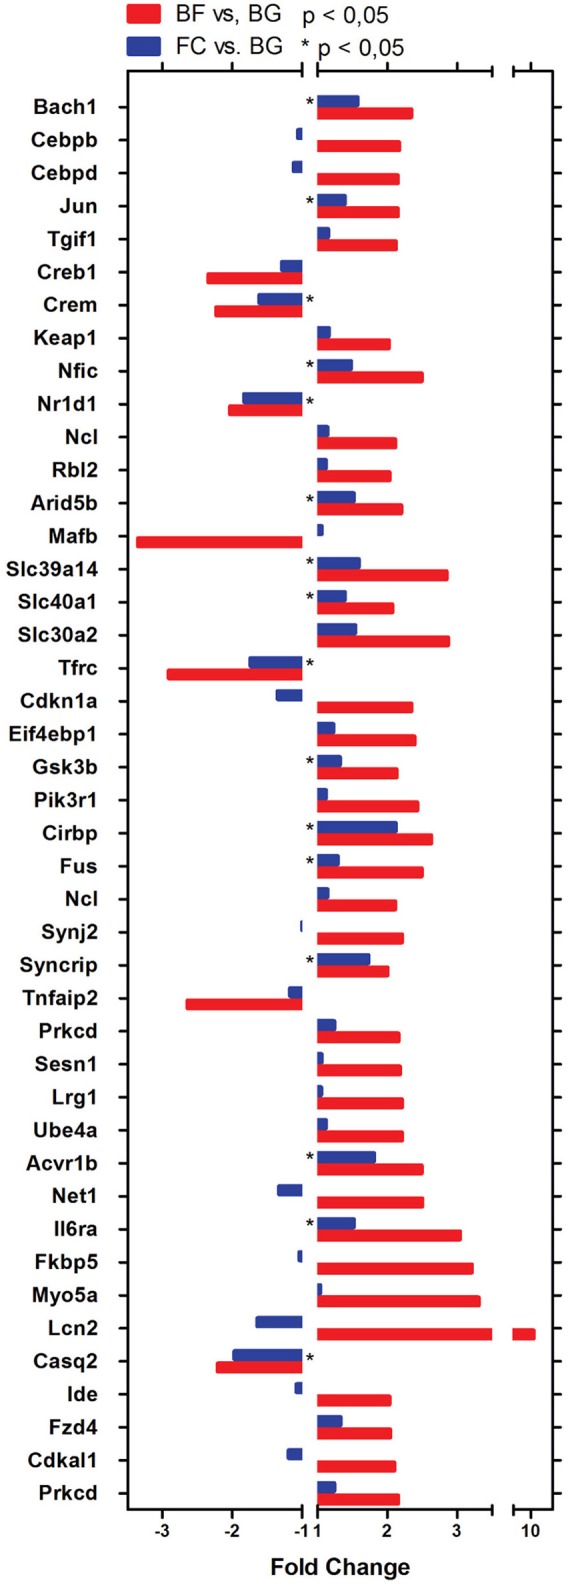
Figure 4.

Genes differentially regulated in longissimus dorsi of spaceflown mice identified by DAVID analysis. Bar Chart representing genes linked to the main biological functions in BF vs. BG (red bars) and FC vs. BG (blue bars) comparison identified using DAVID analysis. All gene transcripts in BF vs. BG are significantly dysregulated (p < 0.05). For FC vs. BG transcripts significantly differentially regulated are indicated by *p < 0.05.
