Figure 3.
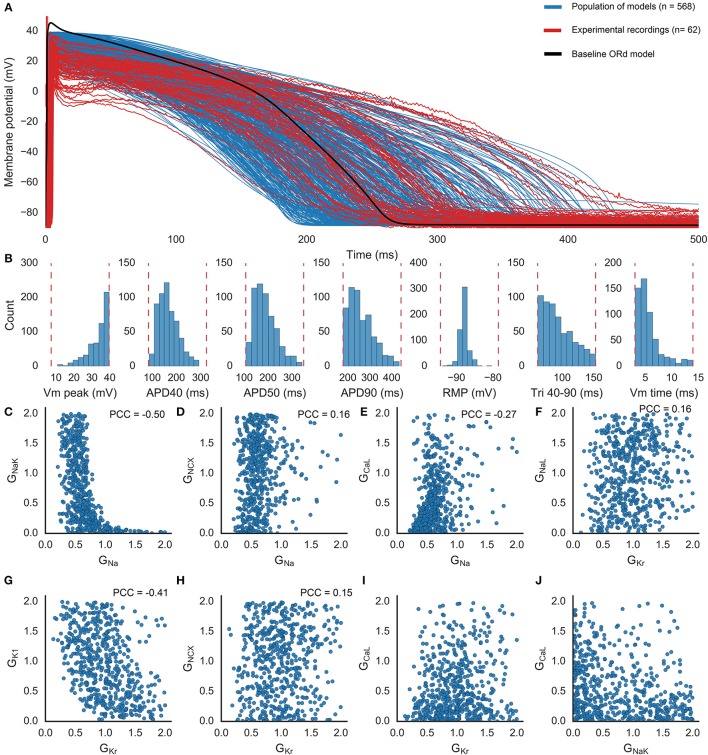
Population of human ventricular cell models. (A) APs obtained from control experimental recordings (red; n = 62 including three excluded outliers, two with long time to peak and one with long APD90); simulations using the models found to be within the experimental range (blue; n = 568); and the baseline ORd model (black), at 1 Hz pacing. (B) Distributions of each biomarker across the population of models. Dashed lines indicate the experimental range used to determine whether each model is accepted into the population. (C–J) Selected pairs of conductances across the population of models. Plots show scaling values relative to the value of each conductance in the baseline ORd model. Partial correlation coefficients (PCC) are shown for the six pairs of parameters with significant correlations (p < 0.05/36).

