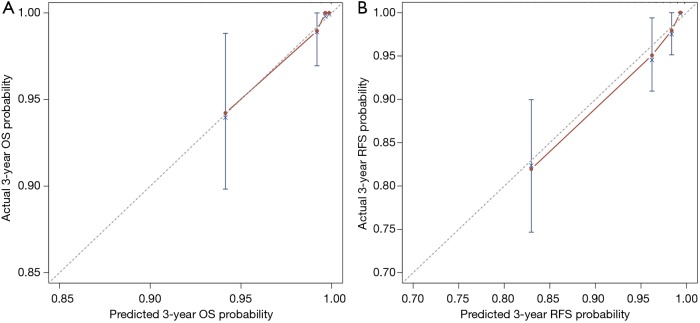
Figure 2.
The calibration curves for predicting overall survival (OS) (A) and recurrence free survival (RFS) (B) at the time point of 3 years in the patient cohort. Nomogram-predicted survival probability is plotted on the x-axis; actual survival probability is plotted on the y-axis. A curve along the 45-degree line indicates perfect calibration models.

