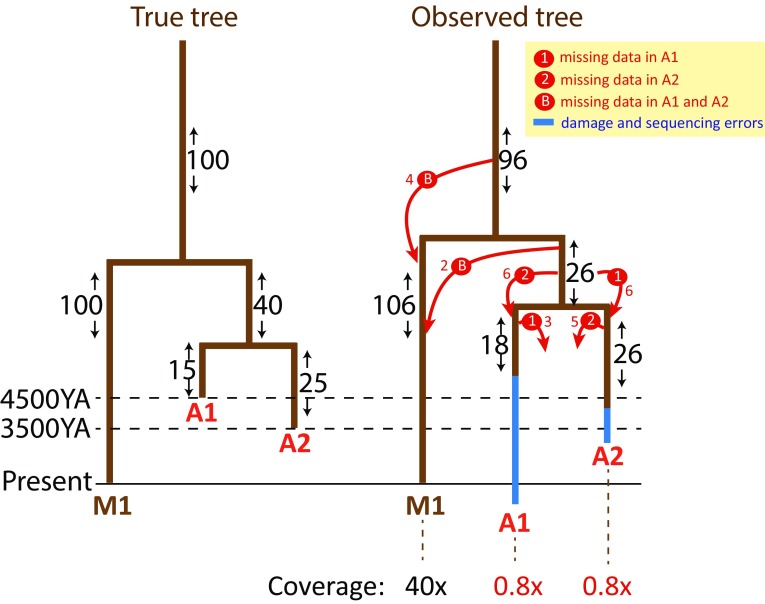
Fig. 1.
Effect of low coverage of the data and post-mortem damage on the inferences of branch lengths and on the phylogenetic mapping of mutations to the tree. A general example of phylogenetic relationships between one high coverage modern (M1) and two low coverage ancient (A1 and A2) samples is shown. The number of mutations mapping to each branch is shown on both trees. The change in numbers of mutations mismapped due to low coverage on each branch of the tree is explained with the red arrows that indicate the directionality of the mismapping. A1 is shown to carry more damage-induced mutations than A2. Modified from Poznik et al. (2016), Supplementary Figure 18

