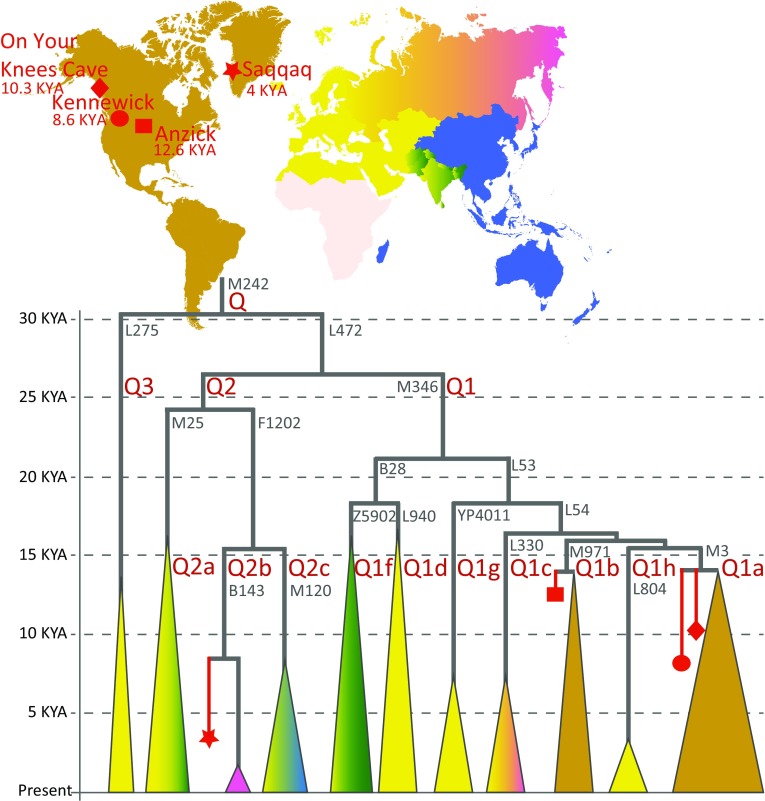
Fig. 8.
The main branches of Y chromosome haplogroup Q in ancient and present-day populations. The structure of the major sub-clades is drawn in proportion to time according to estimates from high coverage genomes of present-day populations (Karmin et al. 2015; Poznik et al. 2016), http://isogg.org/tree/ISOGG_HapgrpQ.html, https://www.yfull.com/tree/Q/). The phylogenetic mapping of ancient Y chromosomes (Kemp et al. 2007; Rasmussen et al. 2010, 2014, 2015) is shown with red symbols. Haplogroup-defining marker names are shown in grey font next to relevant branches

