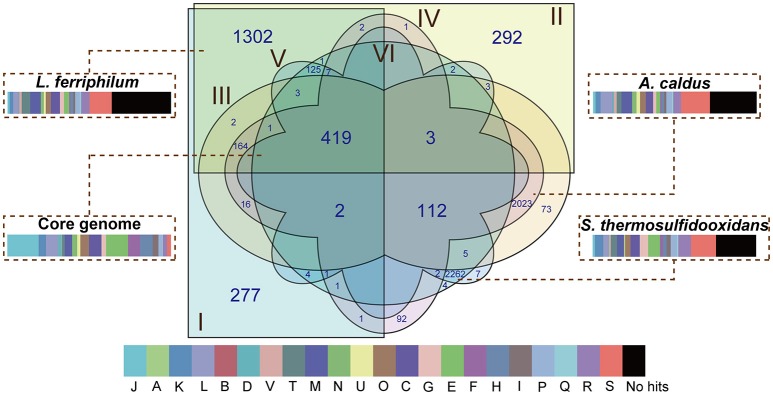
Figure 2.
Venn diagram depicting orthologous and non-orthologous genes. L. ferriphilum DX (I), L. ferriphilum ZJ (II), A. caldus DX (III), A. caldus ZJ (IV), S. thermosulfidooxidans DX (V), and S. thermosulfidooxidans ZJ (VI) are shown in different colors. The numbers shown in the Venn diagram indicate the number of orthologous or strain-specific genes. If no number is given in certain patterns, it suggests there is no orthologous protein among these strains. The core genome and unique genes in each species were used for functional analysis based on COG classification. The descriptions of the COG categories are provided in Figure S1. The width of rectangle indicates the percentage of CDS compared to the entire genome of individual strains.

