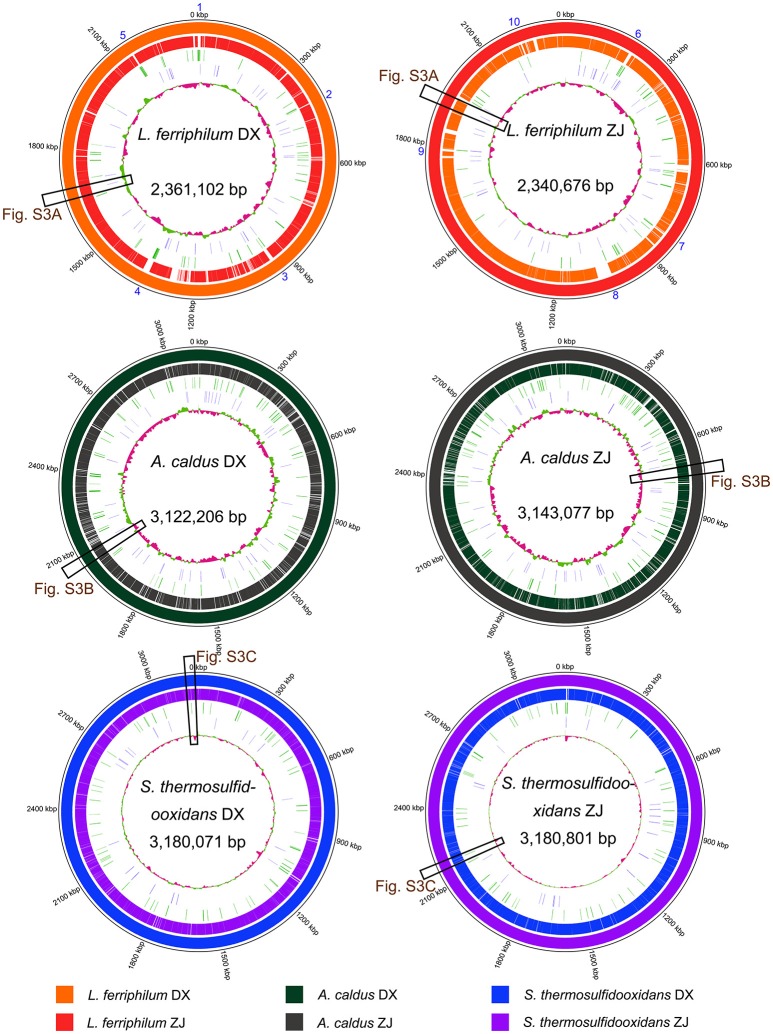
Figure 3.
Reference-based whole genome comparisons and visualization of each strain. GC contents of individual genomes are indicated in the center of the figure. In addition, tRNA and transposases are shown on the second and the third rings from the inside. Matches to the reference genomes (≥ 50% sequence identity) are shown with different colors. Cross references showing further analysis of certain genomic regions are linked to other figures. Detailed description for genomic regions 1–10 in L. ferriphilum isolates are shown in Table S1.

