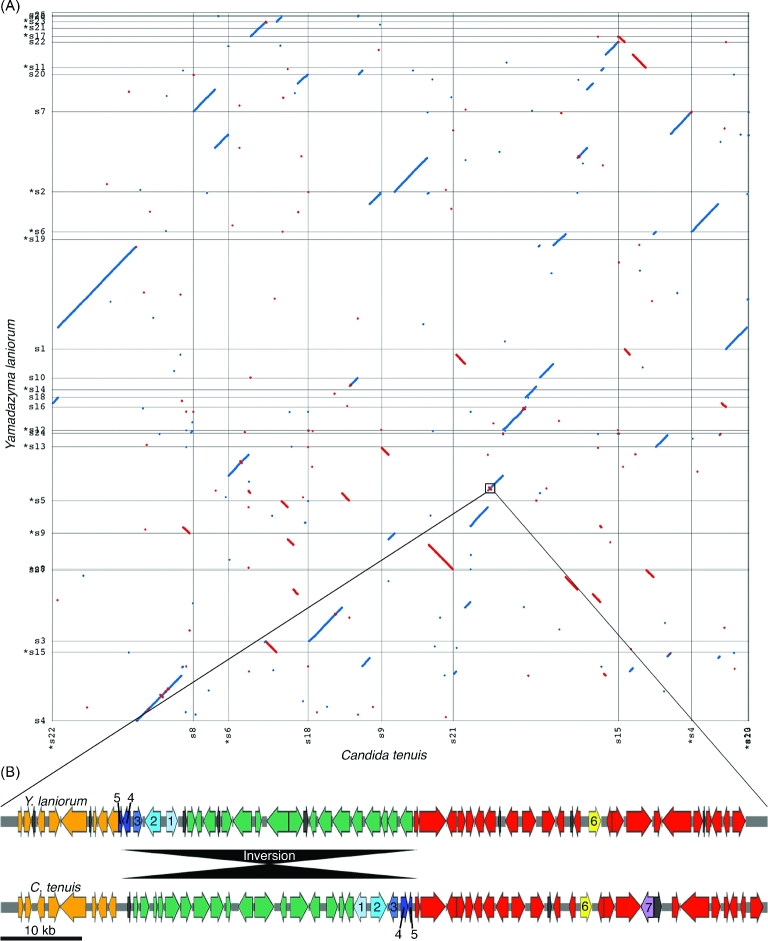
Figure 3.
Synteny analysis between C. tenuis and Y. laniorum (A). Scaffolds are labeled on the X and Y axis, and a * indicates the reverse complement of the scaffold is used in the alignment. The zoomed-in region (100 Kb) shows the GALactose cluster and flanking regions (B). Numbers indicate genes of interest, (1) GAL1, (2) GAL10, (3) GAL7, (4) ORF-Y, (5) ORF-X, (6) K1F, (7) the gene encoding a putative lactose permease. Colored regions indicate regions of homology, while black colored ORFs indicate non-homologous intervening genes.

