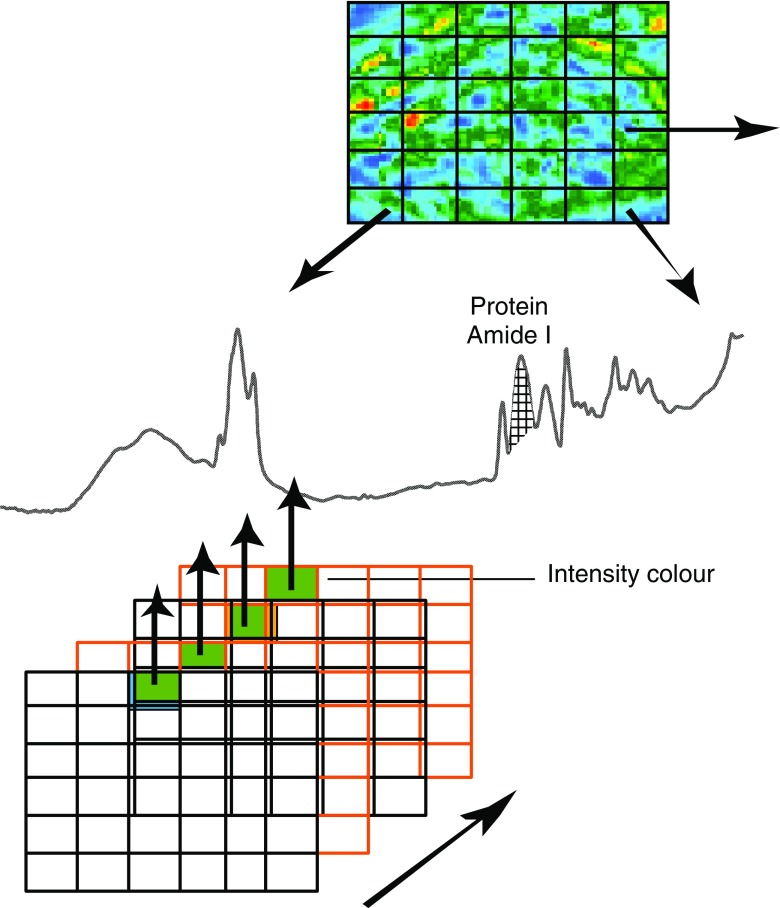
Fig. 2.
Focal-plane array FTIR imaging technique showing multiple grids. Each grid represents an image of the absorbances of the sample at a particular wavenumber. The spectrum of a point on the sample is represented by the line of a particular pixel through all the grids. The IR images can be constructed based on the intensity, area or relative diagnostic band ratios, resulting in a functional group map showing the distribution of specific band(s) of interest on the sample

