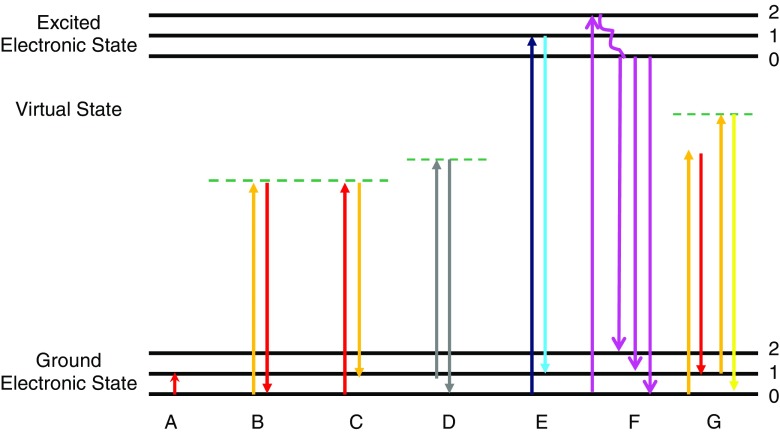
Fig. 3.
Schematic representations of infrared absorption (A), Rayleigh scattering (B), Stokes Raman scattering (C), anti-Stokes Raman scattering (D), resonance Raman scattering (E), fluorescence (F), coherent anti-Stokes Raman spectroscopy (CARS) (G). The numbers 0–2 represent different vibrational levels (νvib) within each electronic state

