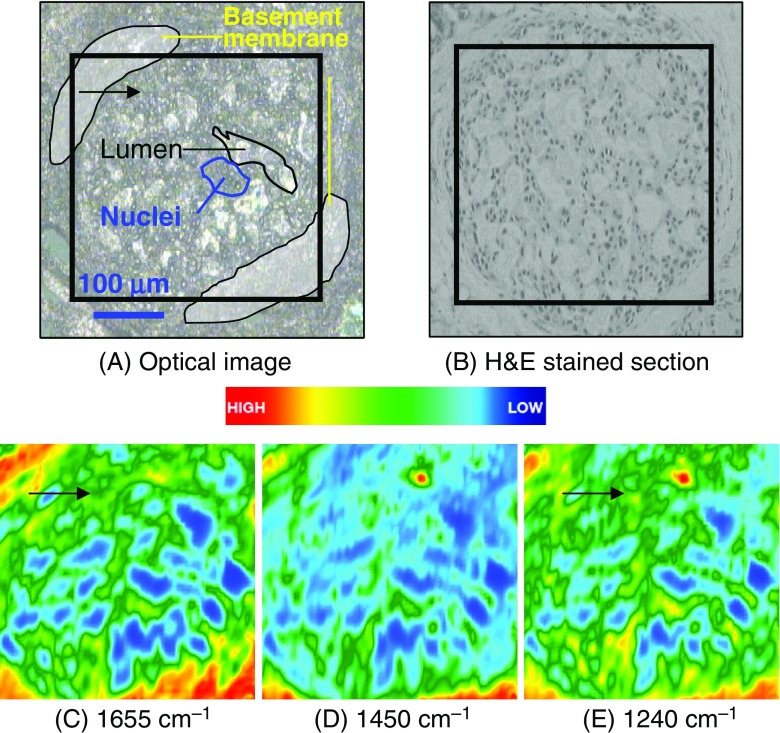
Fig. 4.
Images of a 5-μm thick deparaffinized ormalin-fixed, paraffin-embedded ductal carcinoma in situ tissue section. Optical images of unstained (a) and adjacent hematoxylin and eosin-stained (b) sections. The area imaged using FTIR spectroscopy is marked by the black square. IR maps of proteins (c), lipids (d) and nucleic acids (e) are shown. Experimental conditions: 64 × 64 array (4096 spectra); 256 scans; 4 cm−1;×15 magnification; image area: 350 × 350 μm2

