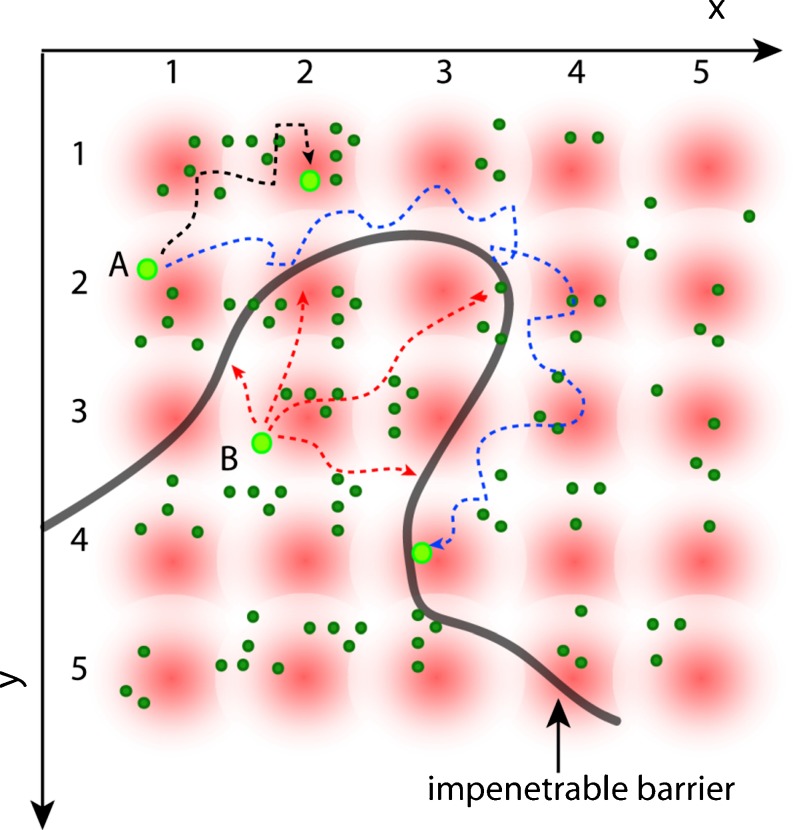
Fig. 2.
Schematic of the spatial pair-correlation method. The fluorescence intensity is rapidly sampled (compared with the motion of the particles) at several points in a grid (x, y) and repeatedly in time. An impenetrable barrier (black line) is placed in the grid defining two disconnected regions. Molecules are allowed to diffuse freely within both regions but not across the boundary. Only the same particle will produce an average cross-correlation with a given time delay at two different points in the grid. For example, the fluctuations of intensity at position (1,2) from molecule ‘A’ will correlate with the fluctuations at position (2,1) if the molecule ‘A’ is moving to that position. Analogously, the same molecule can be detected at position (3,4) in the grid, but after a certain delay due to the time needed to pass around the obstacle. Instead, if we consider the paths allowed for molecule ‘B’ to diffuse from position (2,3) we find that fluctuation of intensity will never correlate with points on the other side of the barrier. Thus, if we cross-correlate the intensity fluctuations at each point of the grid, we produce a map of molecular flow with a resolution given by the size of the PSF

