Fig. 6.
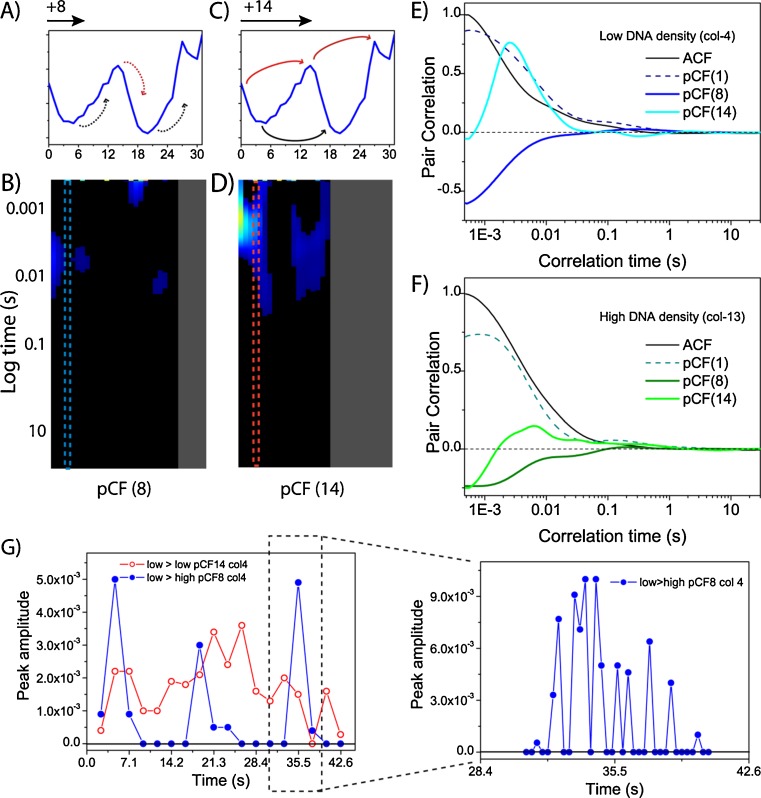
pCF carpet analysis of intranuclear diffusion. a, b Intensity profile of the Hoechst 33342 stain across the line measured. c, d pCF carpets corresponding to the distances of 8 and 14 pixels, respectively. e, f Plot of the amount of correlation for column 4 and 13 at each analysed distance (0, 8 and 14). Curves are normalized to 1 with respect to the ACF. g Decomposition of column 4 into shorter time fragments (5,000 lines, 2.36 s) at the two calculated distances. A plot of the maximum amplitude of correlation detected for each fragment against the time of acquisition is shown. A peak in the pCF(8) analysis is further decomposed every 600 lines (300 ms) (right plot). Figure partly taken from Hinde et al. (2010)

