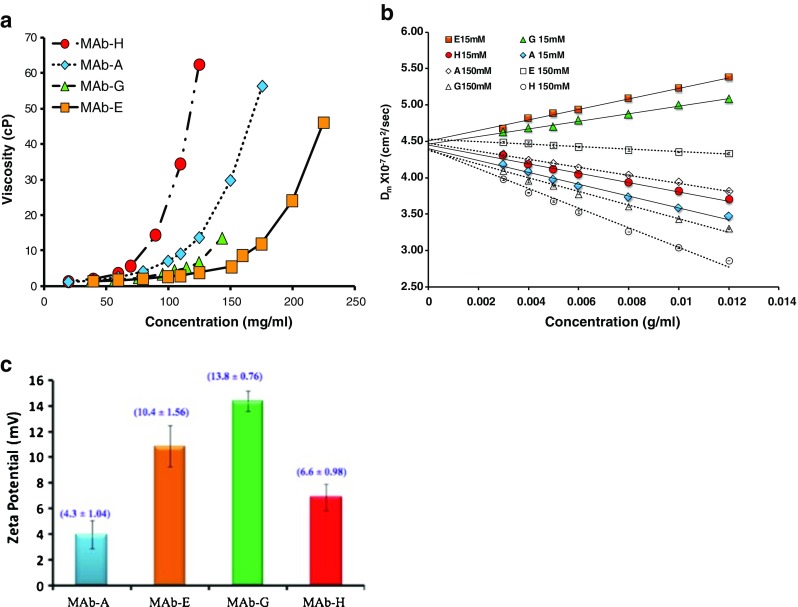
Fig. 5.

a Viscosity of IgG1 MAbs in pH 6.0, 15 mM ionic strength as a function of concentration. The lines connect the data points to guide the eye and are not the result of model fitting. b Mutual diffusion coefficient (Dm) for four IgG1 MAbs at pH 6.0 at 15 mM ionic strength (solid symbols) and 150 mM ionic strength (open symbols). Ionic strength was adjusted with addition of NaCl. The lines are linear best fits to Eq. (5) with slope and intercept representing DskD and Ds (self-diffusion coefficient), respectively. c Zeta potential of IgG1 MAbs at solution pH 6.0, 15 mM ionic strength. The measurements are performed at a concentration of 5 mg/mL at 25 ± 0.1 °C. The number in parentheses represents the effective charge calculated from Eq. 4 in Yadav et al. (2010b). The result is an average of five measurements. Previously published in Yadav et al. (2010b)
