Fig. 7.

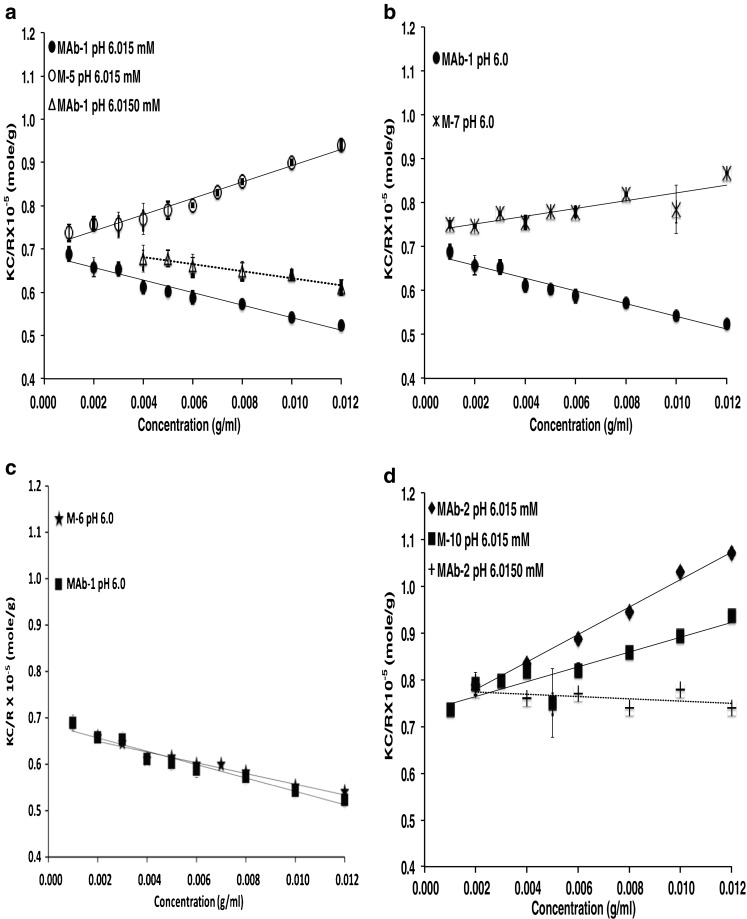
Debye plots for a MAb-1 and M-5, b MAb-1 and M-6, c MAb-1 and M-7, d MAb-2 and M-10. The lines are linear best fits with slope and intercept representing (2B 22) and (1/M w) respectively. Reproduced from Yadav et al. (2012a)

Debye plots for a MAb-1 and M-5, b MAb-1 and M-6, c MAb-1 and M-7, d MAb-2 and M-10. The lines are linear best fits with slope and intercept representing (2B 22) and (1/M w) respectively. Reproduced from Yadav et al. (2012a)