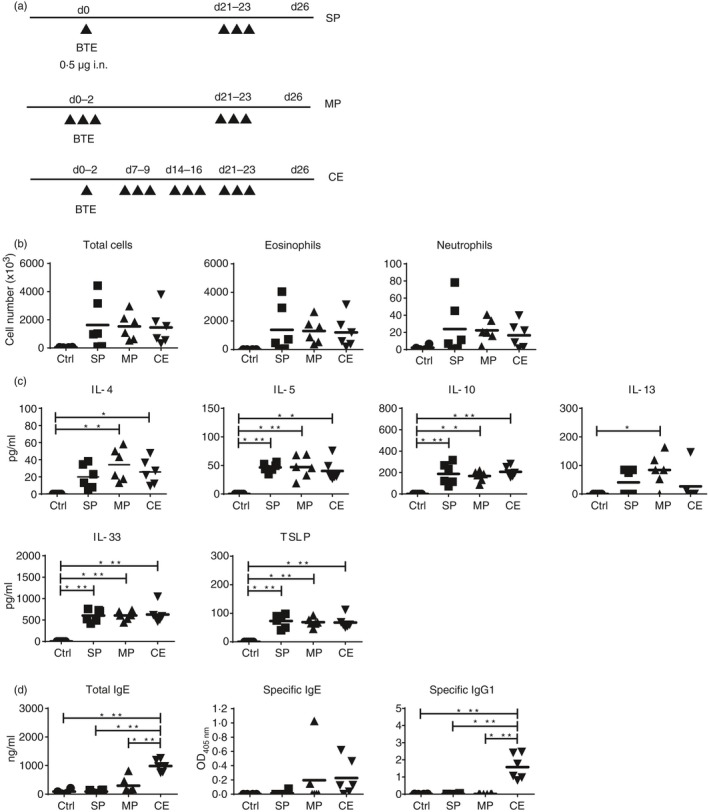
Figure 5.

Low‐dose continuous exposure produces a stronger antibody response. (a) Schematic protocol of different low‐dose priming models. The upper protocol is single low‐dose priming (SP) group (0·5 μg followed by three challenges of 0·5 µg), the middle is the multiple priming (MP) group (3 × 0·5 µg followed by three challenges of 0·5 µg), and the lower is the continuous exposure (CE) group (12 × 0·5 µ). (b) Differential cell counts in bronchoalveolar lavage fluid (BALF); (c) levels of T helper type 2 cytokines and epithelium‐derived cytokines in BALF; (d) total IgE, Blomia tropicalis extract (BTE) ‐specific IgE and IgG1 levels in serum. Each dot represents an individual mouse. Bars indicate mean with six mice/group/experiment (n = 6). Ctrl; PBS control. Statistical analysis was performed using analysis of variance with Tukey's test, *P < 0·05, **P < 0·01, ***P < 0·001.
