
Figure 7.
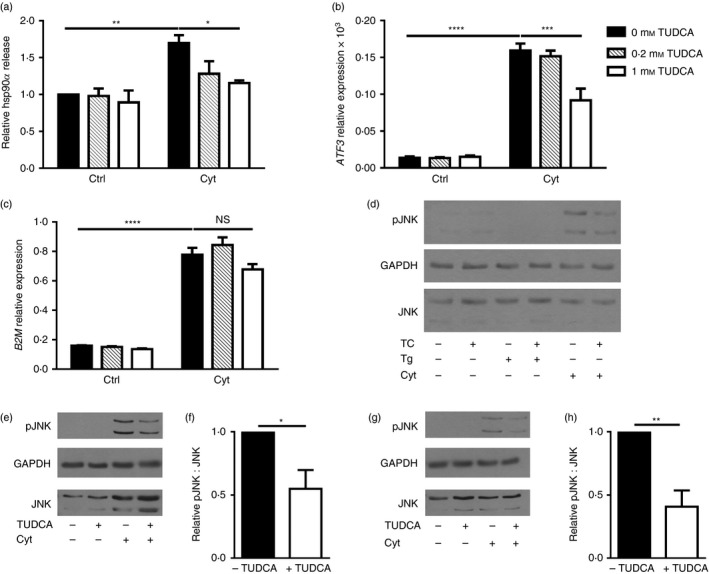
Pre‐treatment with TUDCA inhibited beta cell heat‐shock protein 90α (hsp90α) release, ATF3 up‐regulation, and c‐Jun N‐terminal kinase (JNK) phosphorylation in response to cytokine stress. Human βLox5 cells were treated with media alone, 0·2, or 1 mm TUDCA for 6 hr followed by 24 hr of stimulation with interleukin‐1β (IL‐1β), tumour necrosis factor‐α (TNF‐α) and interferon‐γ (IFN‐γ) (Cyt). Extracellular hsp90α release was measured by ELISA and calculated relative to control cells cultured without cytokines or TUDCA (a). Extracellular hsp90α values ranged between 5·0 and 20·5 ng/ml. ATF3 expression levels were measured by quantitative RT‐PCR (b). Gene expression levels of B2M, which encodes β2‐microglobulin, a component of the MHC class I, were measured by quantitative RT‐PCR (c). For (a–c), data are mean + SEM of n = 3 experiments. Phospho‐JNK, total JNK, and GAPDH levels were examined in βLox5 cells pre‐treated with or without TUDCA (TC) for 6 hr followed by 24 hr of thapsigargin (Tg) or pro‐inflammatory cytokine (Cyt) exposure (d). Shown is a representative Western blot image from n = 3 blots. Phospho‐JNK and total JNK levels were examined in βLox5 cells pre‐treated with or without TUDCA (TC) for 6 hr followed by 30 min (e, f) or 24 hr (g, h) of pro‐inflammatory cytokine (Cyt) exposure. JNK and phosphor‐JNK migrate as doublets on SDS–PAGE, while GAPDH protein levels were assessed in samples as a loading control. (e, g) Representative images, (f, h) densitometry results of phospho‐JNK to total JNK ratios in cytokine‐treated cells with and without TUDCA pre‐treatment for n = 3 or n = 4 blots. *P < 0·05, **P < 0·01, ***P < 0·001, ****P < 0·0001.