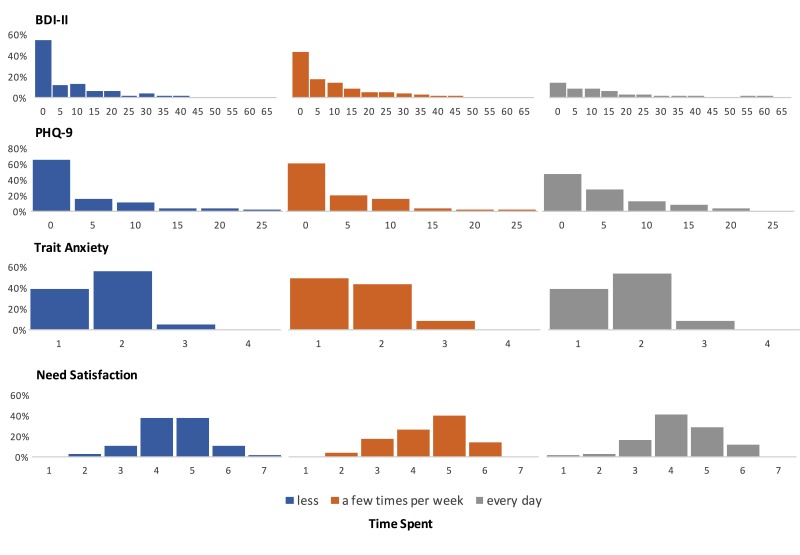
Figure 2.
Bar charts of the constructs of well-being (Beck’s Depression Inventory [BDI-II], Patient Health Questionnaire [PHQ-9], Trait Anxiety, and Need Satisfaction) displayed for each level of time spent (less, a few times per week, every day). For each construct, the chart shows the count per bin on the x-axis, represented as a percentage of participants in that level of time spent.

