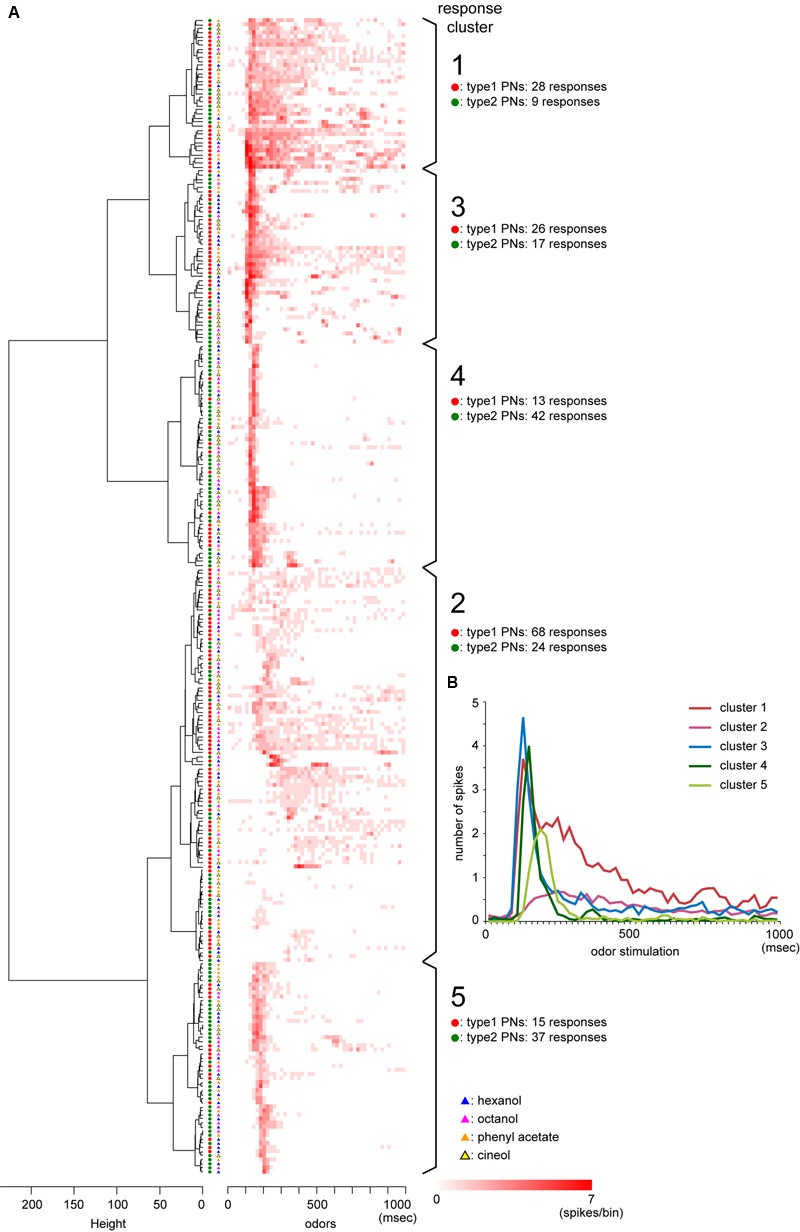
FIGURE 6.

Clustering of temporal activity patterns of PNs. (A) Results of cluster analysis. We classified temporal activity patterns of 284 PN responses into five response clusters based on the cluster dendrogram (left panel) formed by Ward’s method. The heat map shows PSTHs with a bin of 20 ms, and the heater color represents the higher spike activities within the bin. Red and green circles represent responses from type1 and type2 PNs, respectively. Responses to hexanol, octanol, phenyl acetate, and cineol are, respectively, denoted as blue, pink, orange, and yellow triangles. (B) Averages of PSTHs in each of five response clusters.
