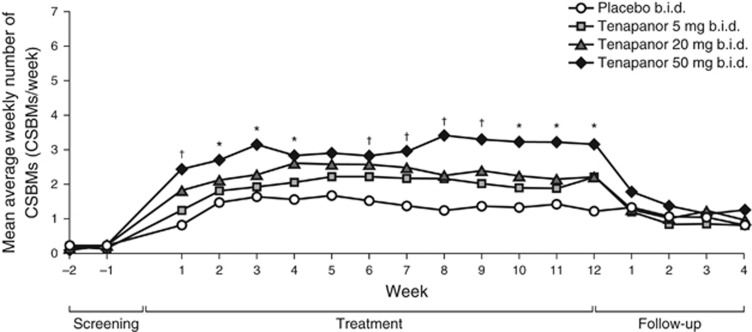
Figure 3.
Mean average weekly number of CSBMs over time (intention to treat analysis set). *P<0.050, tenapanor 50 mg b.i.d. vs. placebo. †P<0.050, tenapanor 20 mg b.i.d. and tenapanor 50 mg b.i.d. vs. placebo. P values were based on an analysis of covariance model with treatment and pooled investigator site as factors and baseline value as a covariate. b.i.d., twice daily; CSBM, complete spontaneous bowel movement.

