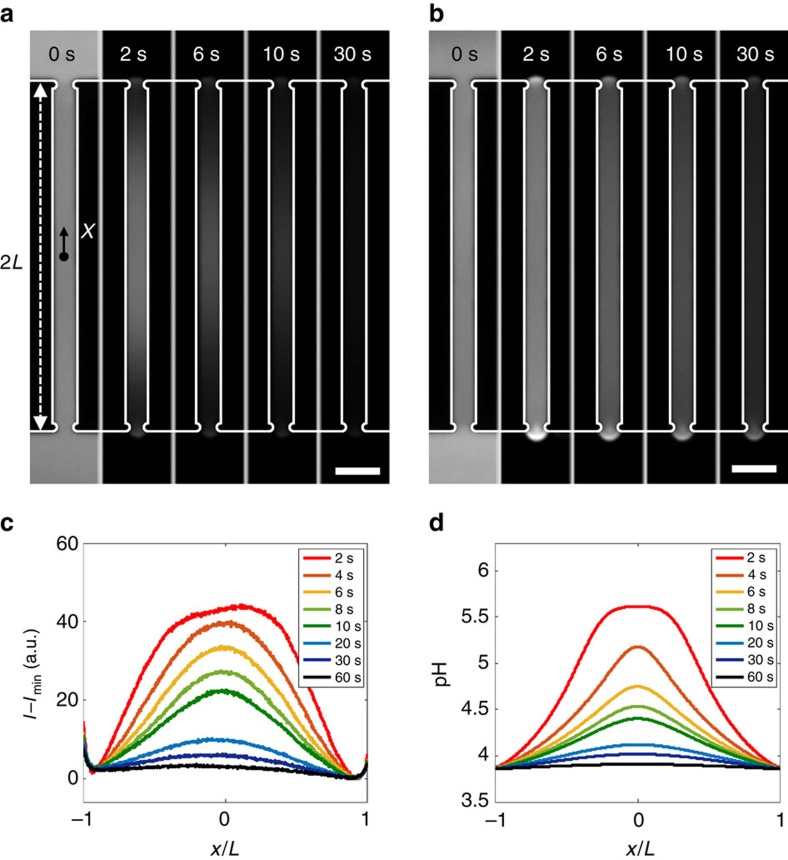
Figure 2. pH change in water upon exposure to gas.
(a,b) Image sequences showing fluorescence intensity in aqueous Oregon Green solution (0.1 mM) exposed to (a) CO2 and (b) N2, both at a pressure of 136 kPa. (c) Fluorescence intensity (I) distribution, reported as I−Imin to account for photobleaching, along the centre of the channel shown in a. Imin is the minimum intensity in the channel. (d) Computed pH distribution in water exposed to CO2 at 136 kPa. All scale bars are 100 μm.

