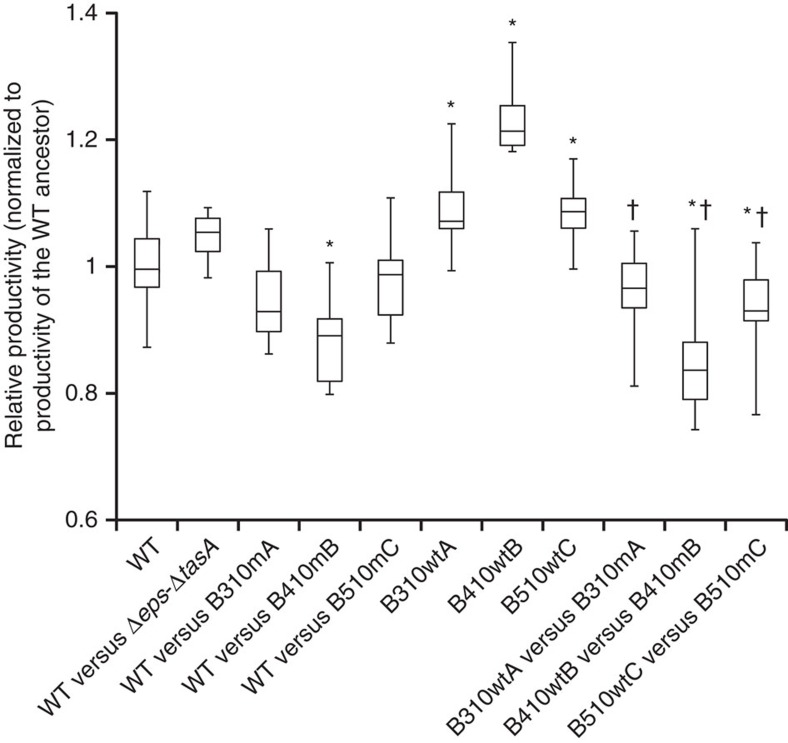
Figure 4. Productivity assay based on biofilm biomass.
Productivity of Δeps–ΔtasA ancestor and eNMPs B310mA, B410mB and B510mC, respectively, in co-cultures with WT ancestor, monocultures of eMPs B310wtA, B410wtB and B510wtC, and co-cultures of eNMPs with corresponding eMPs compared to the WT ancestor (n=10; t-Student; two-tail P<0.05). Boxes represent Q1–Q3, lines represent the median, and bars span from max to min. Each WT versus co-culture/eMP comparison was replicated at least twice. *—productivities significantly different from the WT ancestor. †—productivities significantly lower from the corresponding eMP cultures.

