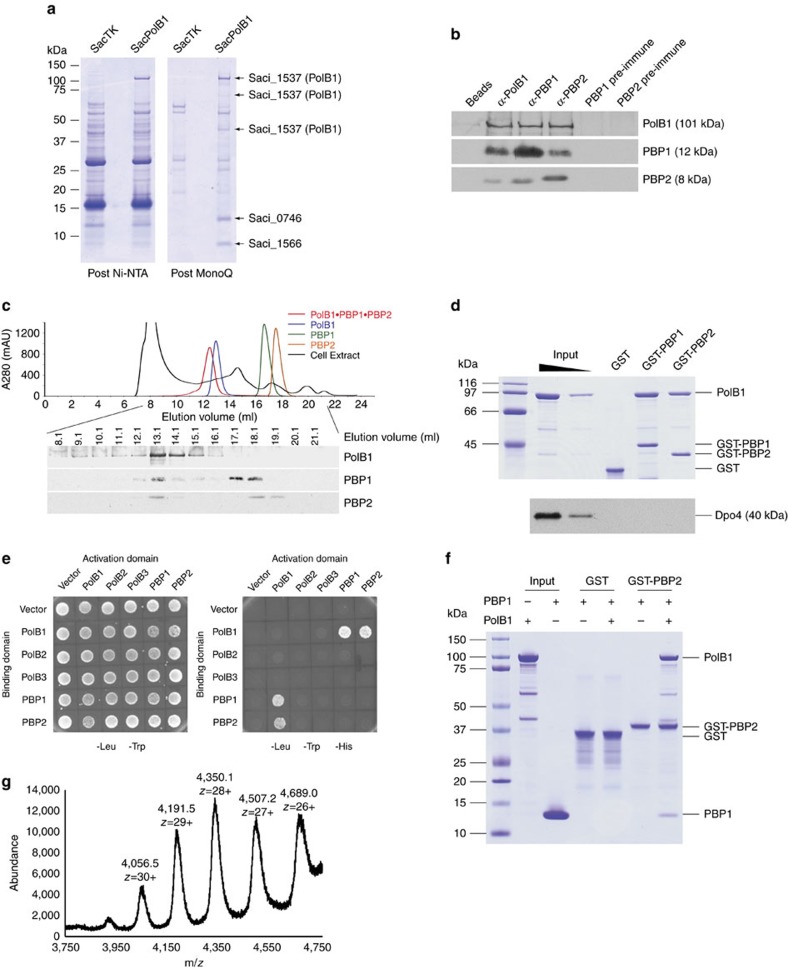
Figure 1. Identification of a PolB1-containing holoenzyme.
(a) Cell lysates of SacTK (control strain) and SacPolB1 were passed through Ni-NTA and MonoQ columns. The migration of molecular weight markers is indicated on the left of the Coomassie stained 4–12% gradient SDS–PAGE gels. Species identified by mass spectrometry are indicated on the right. (b) All three proteins co-immunoprecipitate from Sso cell extracts. Anti-sera used in each immunoprecipitation reaction are indicated on the top (‘Beads' denotes no antibody added). Anti-sera used in western blotting are indicated on the right. See Supplementary Fig. 10 for uncropped western blots. (c) Gel filtration analysis of cell extracts. Gel filtration column profiles for each recombinant protein (colour coded) and Sso cell extract (black) are superimposed. Western blot results of the indicated cell extract gel filtration fractions are presented below the profiles, with the anti-sera used in western blotting indicated on the right. See Supplementary Fig. 10 for uncropped western blots. (d) Pull-down of recombinant PolB1 by GST tagged PBP1 and PBP2. Samples were analysed by SDS–PAGE and visualized by Coomassie staining (PolB1) or western blotting using Dpo4 anti-sera. Inputs are 50 and 10%. Molecular weight markers are shown on the left. (e) Interaction between PolB1 and PBP1/PBP2 analysed by yeast two hybrid assay. Successful transformation of yeast with fusion constructs is demonstrated by growth on media lacking tryptophan and leucine (left hand panel). Interaction between the indicated fusion proteins is demonstrated by growth on media lacking tryptophan, leucine, and histidine (right hand panel). (f) PolB1 mediated pull-down of recombinant PBP1 by GST tagged PBP2. Samples were analysed by SDS–PAGE and visualized by Coomassie staining. Inputs are 50%. Molecular weight markers are shown on the left. (g) Native mass determined by electrospray ionization mass spectrometry performed with the PolB1-containing holoenzyme.

