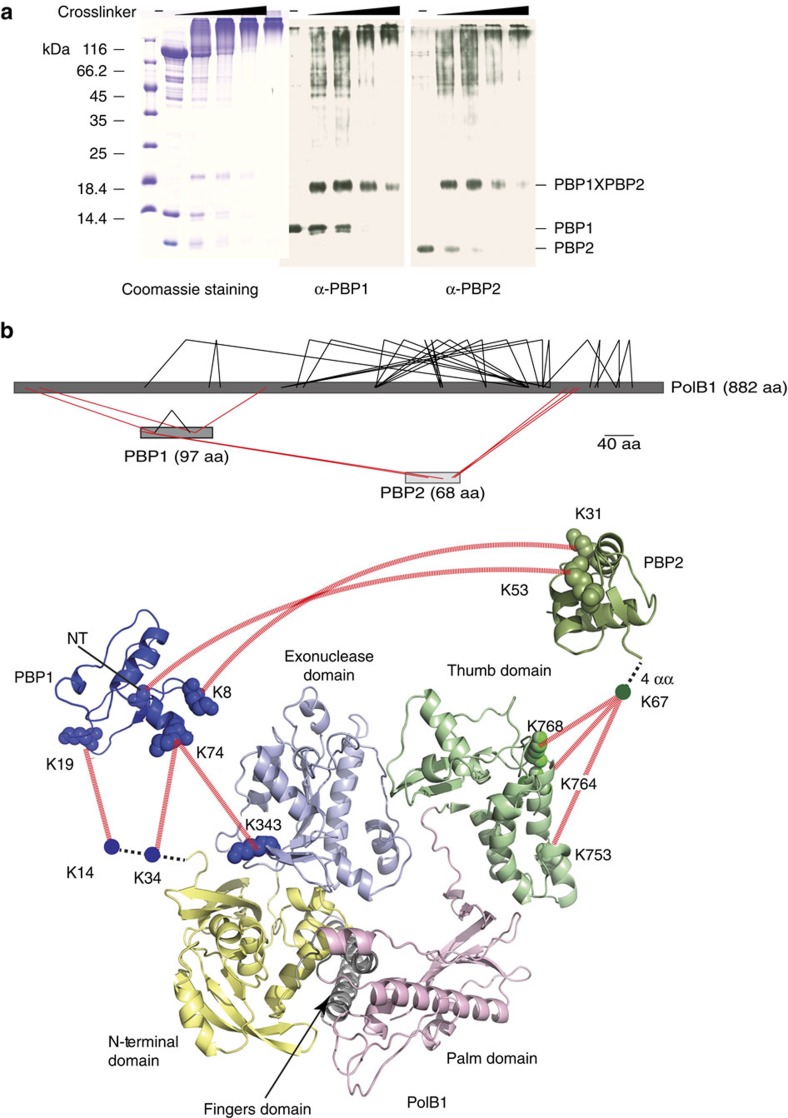
Figure 3. Locations of the sites of PBP1 and PBP2 binding to PolB1.
(a) Titration of 312 μM, 625 μM, 1.25 mM or 2.5 mM BS3 cross-linker with 58 μM holoenzyme complex. Samples were analysed by SDS–PAGE and visualized by coomassie staining (left panel) or western blotting using PBP1 (middle panel) or PBP2 (right panel) anti-sera. Molecular weight markers are shown on the left. (b) Cross-linking results of the holoenzyme complex. Upper panel shows an overview of the cross-linked residues within the complex (See also Supplementary Data 3). Intra- and inter-subunit cross-links are indicated in black and red lines, respectively. Inter-subunit cross-links are mapped to the crystal structures of the individual subunits (lower panel). Different domains of PolB1 are colour-coded and labelled. The cross-linked lysine residues are connected with red lines. NT corresponds to the N-terminal amine group. Dashed black lines represent regions of the proteins for which no structural information is available.

