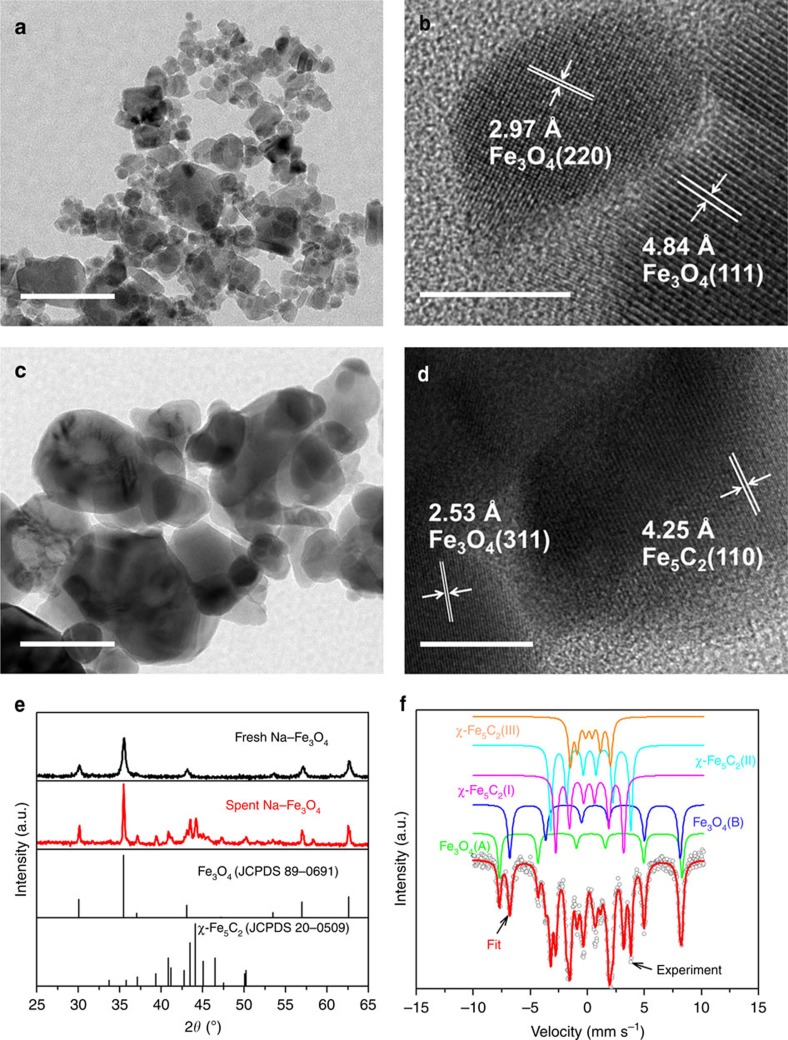
Figure 2. Structural characterization of Na–Fe3O4 catalyst.
(a,c) TEM images of fresh (a) and spent (c) Na–Fe3O4 catalyst. Scale bar, 100 nm. (b,d) HRTEM images of fresh (b) and spent (d) Na–Fe3O4 catalyst. Scale bar, 10 nm. (e) XRD patterns of fresh and spent Na–Fe3O4 catalyst. (f) Mössbauer spectra of spent Na–Fe3O4 catalyst.

