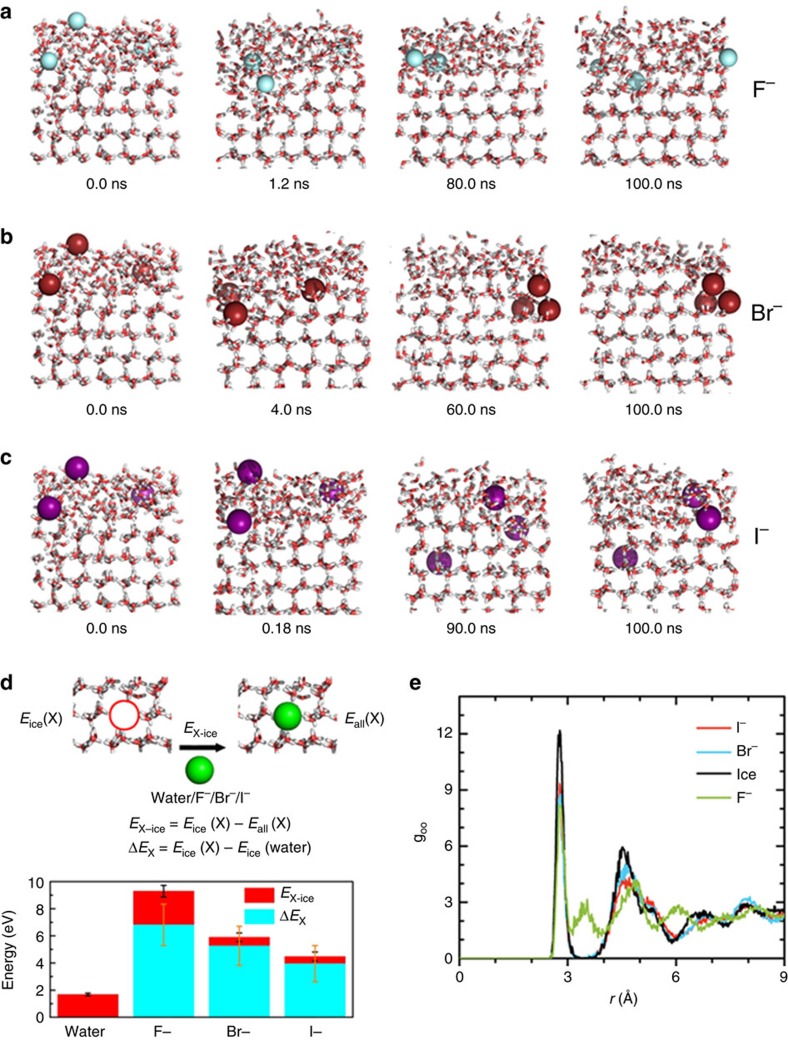
Figure 4. Molecular dynamics simulations.
Snapshots of the MD simulations for illustrating the effect of (a) F−, (b) Br− or (c) I− ions on ice formation at −13 °C. (d) Results of test MD simulation (see Methods) for computing average interaction energy (EX-ice) of a water molecule or an ion with the surrounding water molecules in the bulk ice are depicted by the height of red bars (results being averaged over 50 configurations in the last 100 ps of the 1 ns test MD simulations). Here, Eall(X) denotes the total potential energy of the system after the replacement of two tagged water molecules with X (X=water, F−, Br− or I−) and Na+. The potential energy increase (ΔEX) for the pure ice crystal due to the presence of the embedded ions is marked by the height of cyan bars. The root-mean-square error bars (black and yellow) are calculated based on the data of 50 configures in the last 100 ps. (e) Computed radial distribution functions of O atoms in pure ice and O atoms surrounding the halide ions.

