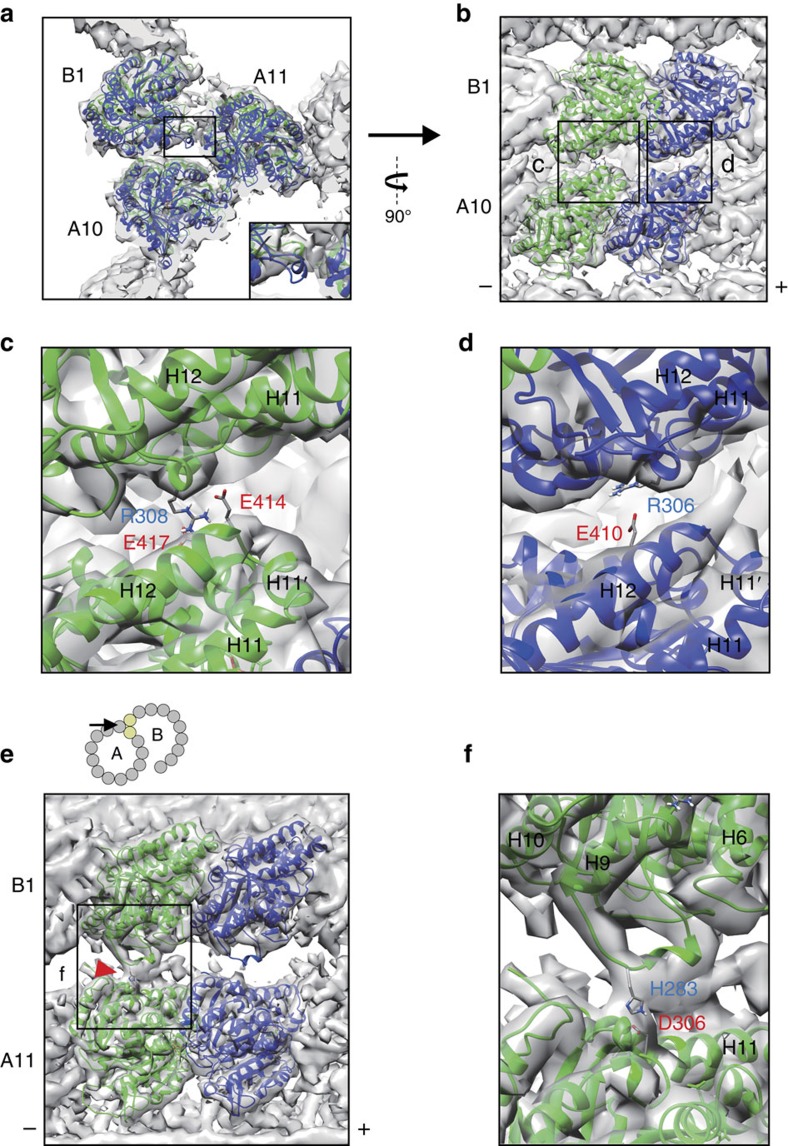
Figure 2. Structure of the outer junction.
(a) The outer junction region highlighted with fitted tubulin molecules in PFs-A10, A11 and B1 viewed from the tip of cilia. Tubulin model fitted in PF-B1 is refined in PF-B1 density map. Inset shows the M-loop of β-tubulin in PF-B1 is sticking out from the density map. (b) Perpendicular view of the interactions between PFs-A10 and B1. (c,d) Magnified views (black boxes in b) show the residues predicted to be involved in non-canonical tubulin–tubulin interactions between tubulins of PFs-A10 and B1. (e) View of interactions between PFs-A11 and B1. Angle and location of the view is indicated in the cartoon. Red arrowhead shows the interaction site between the M-loop of α-tubulin of PF-B1 and α-tubulin of PF-A11. PF-A10 is removed in this view for visualization. (f) Magnified view from e showing the residues predicted to be involved in the PFs-A11 and B1 interaction. (+) and (−) signs indicate plus and minus-ends of microtubule. The α-helix numbers are indicated in c,d and f.

