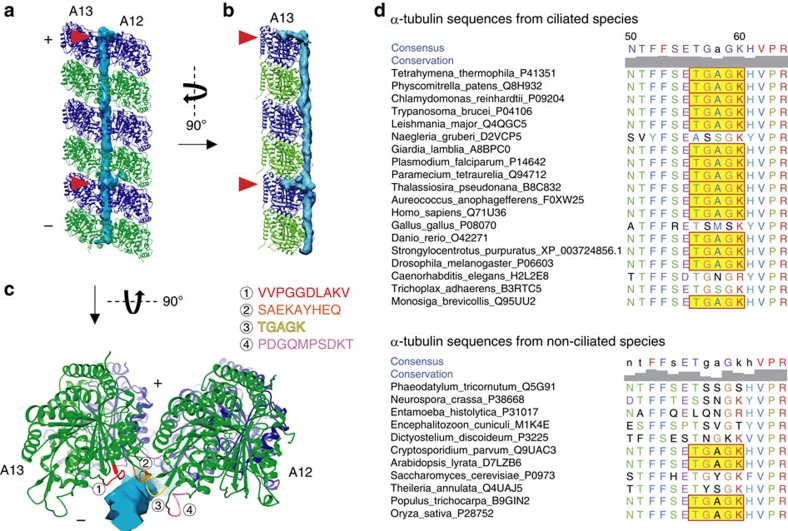
Figure 5. Interactions between fMIP and the tubulin lattice.
(a–c) Views of the surface rendering of fMIP-A12A13 from the 16-nm averaged map together with models of PFs-A12 and A13 from outside the A-tubule (a), from the side of PF-A13 (b) and along the PF axis (c). Insertions to the tubulin lattice are indicated by red arrowheads in a and b. Four possible regions of α-tubulins from PFs-A12 and A13 interacting with fMIP-A12A13 is shown in c. (+) and (−) signs indicate plus and minus-end of microtubule. (d) The multiple sequence alignment of TGAGK region showing high conservation in the ciliated organism but not in the non-ciliated organism (TGAGK is highlighted in yellow). Residue numbers of Tetrahymena tubulin are indicated above. Sequences of other regions and the β-tubulins are shown in Supplementary Fig. 4.

