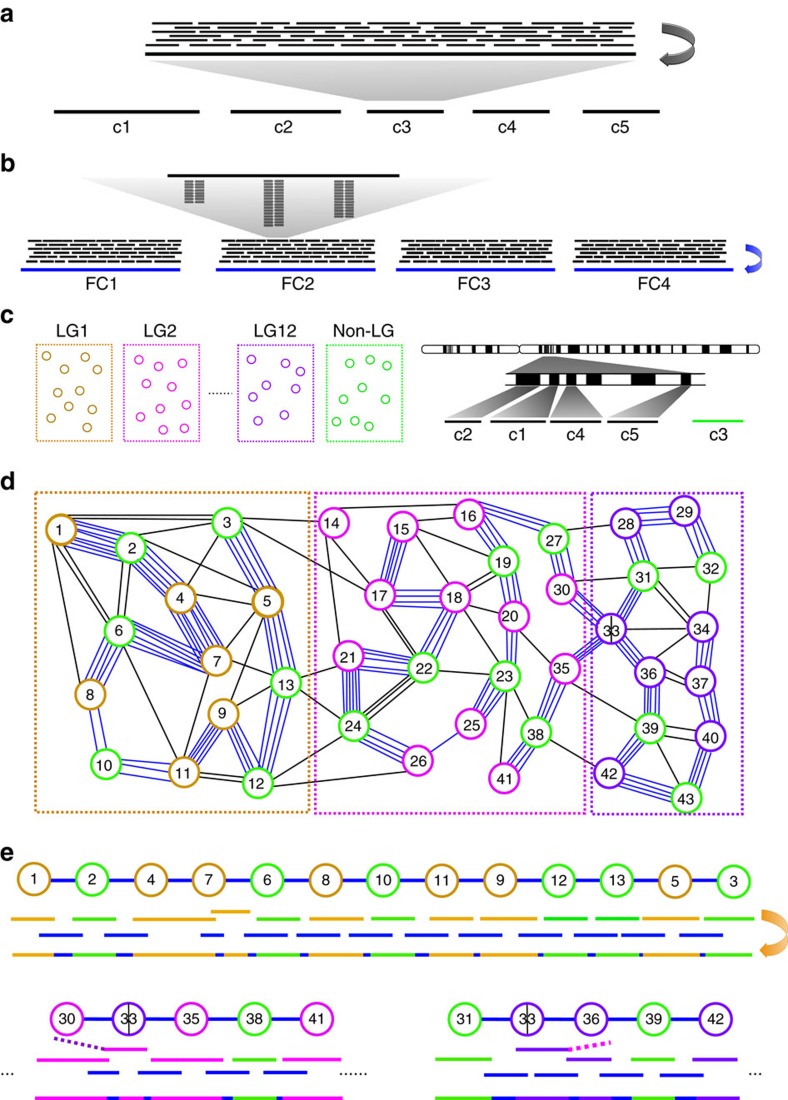
Figure 1. Schematic depiction of the construction of super-contigs.
(a) Whole-genome assembly from corrected SMRT sequences (thin black lines) generates a set of WGS contigs (c1–c5). (b) Sequence tags (stacked short lines) from each fosmid pool are used to retrieve corrected PacBio sequences (black lines), which are then assembled into fosmid contigs (for example, FC1–FC5). (c) Many of the WGS contigs are grouped together and anchored onto chromosomes based on their linkage relationship (LG1–LG12). For example, c1, c2, c4 and c5 are anchored onto a chromosome, but c3 is not (in the non-LG group). Note that c2 and c4 are close to c1 physically, but c5 is not close to them. (d) A simplified overlap graph is constructed using anchored WGS contigs in LG1, LG2 and LG12 and unanchored WGS contigs in the non-LG group as nodes and fosmid contigs as edges (blue lines). A sequence overlap between a WGS contig and a fosmid contig must be at least 5 kb to form a connection. Two WGS contigs can be connected by multiple fosmid contigs. (e) Three most reliable paths from (d), including two partial ones, are selected as described in the Methods section to build super-contigs. The blue lines represent fosmid contigs. The other coloured lines represent WGS contigs. The WGS contigs (including unanchored ones in green) on each path are connected to the best aligned fosmid contigs to form super-contigs. The overlap between two WGS contigs (for example, nodes 4 and 7) causes negative edge length as described in the Methods section. In such cases, the fosmid sequences were used for the overlapping regions to form the super-contig. In all other cases, the WGS contig sequences were used for the overlapping regions. Node 33 represents a chimeric WGS contig, which is split into two parts to be used separately in two super-contigs. Dashed lines represent alignment overhangs.

