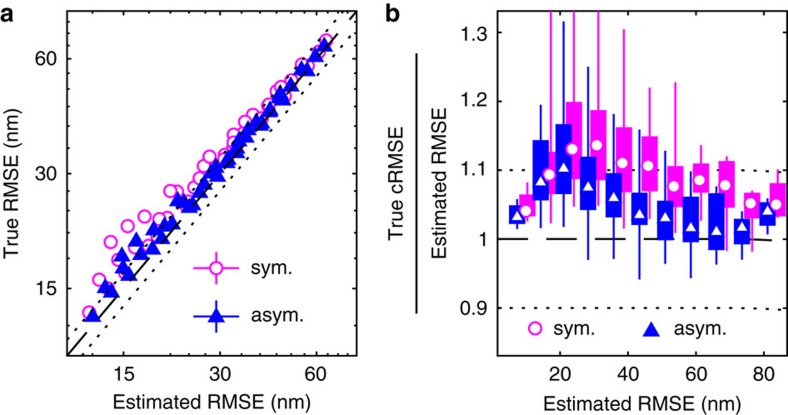
Figure 3. True and estimated precision at longer exposure times.
Results for 0.6< <0.9, using symmetric and asymmetric Gaussian spot models for MAP localization and Laplace precision estimates. Dashed and dotted lines indicate 0% and ±10% bias, respectively. (a) True and estimated RMSEs for each imaging condition with error bars (mostly smaller than symbols) showing bootstrap s.e.m. (b) Conditional RMSE (cRMSE) normalized by estimated RMSE. Symbols, boxes, and lines show the median, 25% and 75% quantiles, and the whole span for all localization conditions.

