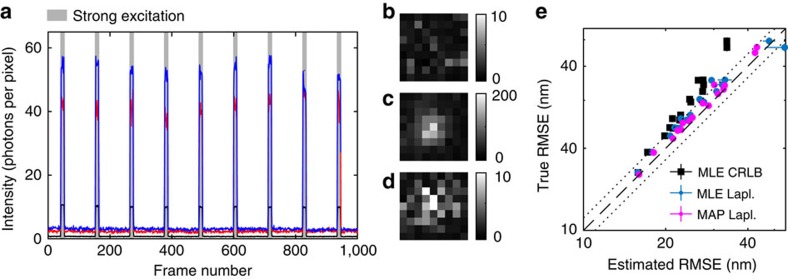
Figure 4. Validating estimators of localization precision using real data.
(a) Intensity in different frames for two different beads (red, blue) and the background (black). Grey areas indicate periods of strong excitation intensity. (b–d) Image examples, 9-by-9 pixels, 80 nm per pixel, colorbar indicates photons per pixel. (b) Background in high intensity frame, and a bead in a (c) high intensity and (d) a low intensity frame. (e) True and estimated RMSEs for individual beads, using MLE localization and CRLB precision estimates, MLE localization and Laplace precision estimates, and MAP localization and Laplace precision estimates. Error bars indicate bootstrap s.e.m. (mostly smaller than the symbols).

