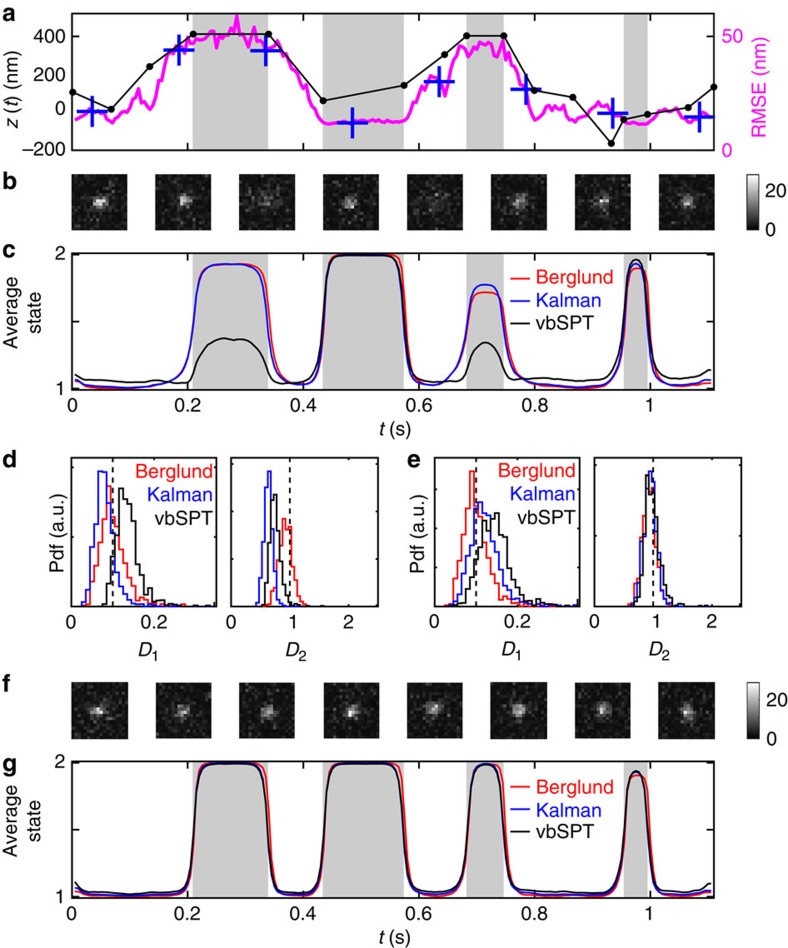
Figure 6. Detecting binding events in and out of focus.
(a) Input z coordinates and RMSEs, and (b) representative spot images along simulated trajectories, from time points indicated by + in a. Grey areas indicate binding events. (c) Average state occupancy for the different HMMs. (d) Distribution of estimated diffusion constants for the two states (probability density function, pdf), with true values indicated by dashed lines. (e) Corrected diffusion constant estimates. (f) Spot images (rendered as in a) and (g) HMM occupancies for trajectories simulated without defocus effects. Spot images are 18-by-18 pixels, with 80 nm pixel size, and the colour bar indicating number of photons per pixel.

