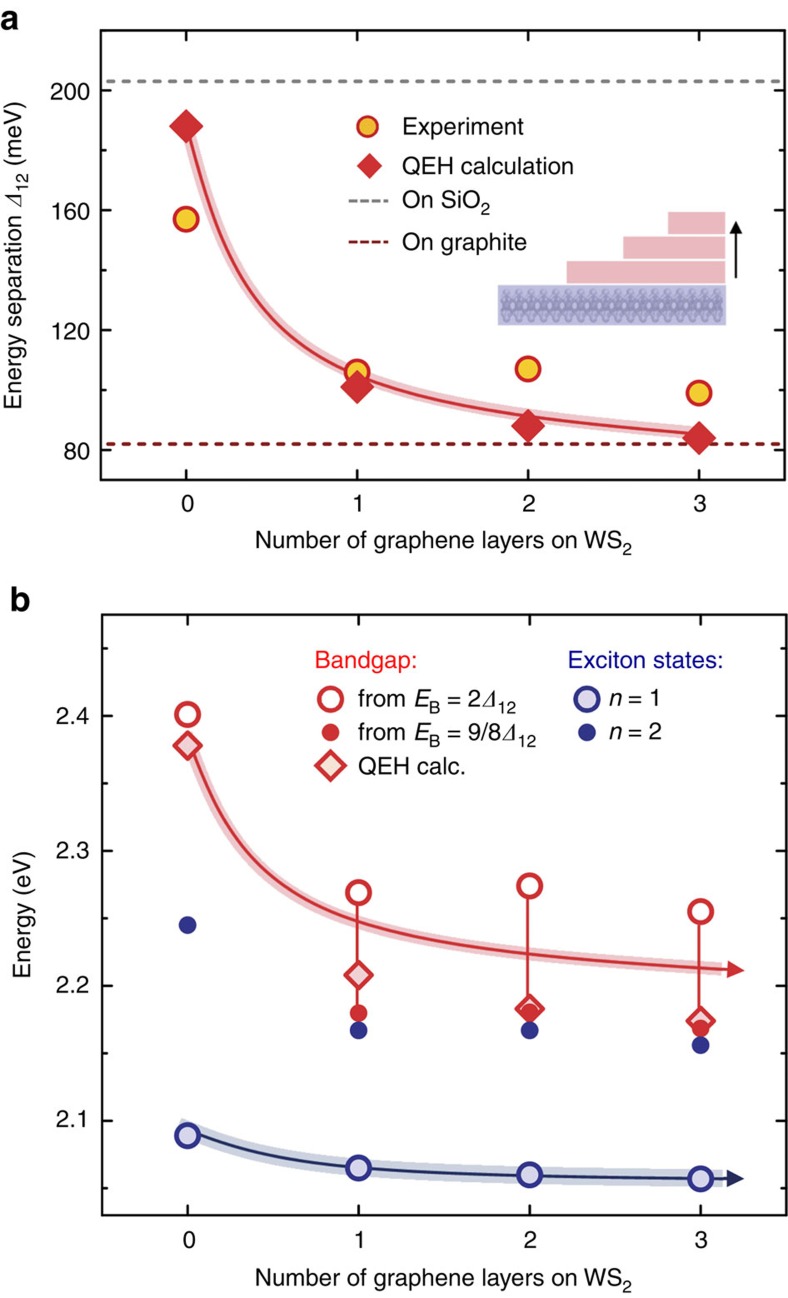
Figure 2. Out-of-plane spatial sensitivity of environmental screening.
(a) Experimentally and theoretically obtained energy separation Δ12 between the n=1 and n=2 exciton states as a function of the number of layers of capping graphene. Dashed lines indicate Δ12 values from the solution of the electrostatic model for uncapped WS2 supported by fused silica substrate (grey) and covered with bulk graphite (red), representing two ideal limiting cases. (b) Absolute energies of the experimentally measured exciton ground state (n=1) and the first excited state (n=2) resonances, as well as the estimated positions of the bandgap obtained by adding the exciton binding energy to the energy of the n=1 state. The binding energy scales with Δ12, where the limiting cases are an experimentally determined non-hydrogenic scaling for WS2 on SiO2 substrate from ref. 24
 and the 2D-hydrogen model in a homogeneous dielectric
  . These are compared to the bandgap energies deduced from the calculated exciton binding energies using the QEH model. The solid lines are guides to the eye.

