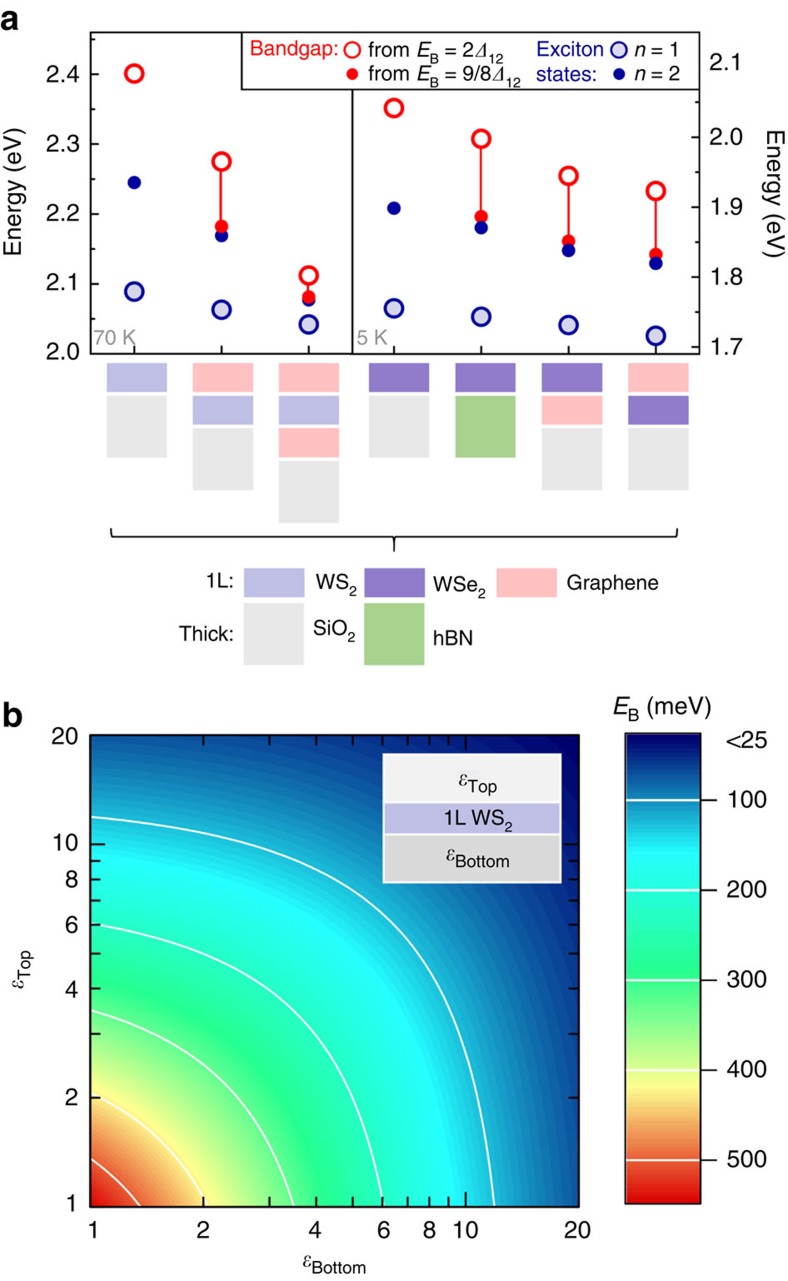
Figure 3. Influence of the choice and configuration of materials on the dielectric tuning of the bandgap.
(a) Experimentally measured exciton ground state (n=1) and the first excited state (n=2) transition energies, as well as the estimated shifts of the bandgap for a variety of heterostructures. Their respective stacking configurations are indicated along the horizontal axis. The bandgap is obtained by adding the exciton binding energy to the measured transition energy of the n=1 state. To estimate the binding energy from the energy separation of the exciton states Δ12, we considered the limiting cases of a non-hydrogenic scaling from ref. 24
 and the 2D-hydrogen model
  . (b) An overview of predicted changes in the exciton binding energy in 1L WS2, encapsulated between two thick layers of dielectrics. The binding energy EB is calculated by using the electrostatic approach in the effective mass approximation and presented in a 2D false-colour plot as a function of the top and bottom dielectric constants. The changes in the magnitude of EB are roughly equal to the corresponding shifts of the bandgap and can reach 500 meV.

